|
|
Table of Contents for Terra
|
Terra/ASTER
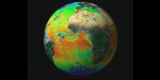
Terra/CERES
Terra/MISR
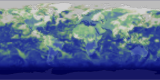
Terra/MODIS
Terra/MOPITT
|
Advanced Spaceborne Thermal Emission and Reflection Radiometer (ASTER) on Terra
|
You can get more information on ASTER at http://asterweb.jpl.nasa.gov/.
|
|
Movie
|
ID
|
Title
|

|
3374
|
Jakobshavn Glacier Flow in the year 2000 and Calving Front Retreat from 2001 to 2006
|

|
3355
|
A Short Tour of the Cryosphere
|

|
3181
|
A Tour of the Cryosphere
|

|
3077
|
Updated History of Jakobshavn Glacier Recession (1850-2004)
|

|
3076
|
Jakobshavn Glacier Calving Front Recession Updated (2001-2004)
|

|
2854
|
Multisensor Fire Observations without Labels (HD Version)
|

|
2853
|
Multisensor Fire Observations with Labels (HD Version)
|

|
2806
|
Multisensor Fire Observations without Labels
|

|
2707
|
Multisensor Fire Observations
|

|
2148
|
AGU Press Briefing May 29th: Measuring Bezymianny Flows; AVHRR vs.ASTER
|

|
2147
|
AGU Press Briefing May 29th: Measuring Bezymianny Flows
|

|
2146
|
AGU Press Briefing May 29th: Global Land Ice Measurements from Space. (Dobbin Glacier Zoom 2)
|

|
2145
|
AGU Press Briefing May 29th: Global Land Ice Measurements from Space. (Dobbin Glacier Zoom)
|

|
2144
|
AGU Press Briefing May 29th: Comparing the Urban Ecology of Two Cities.
|

|
2143
|
AGU Press Briefing May 29th: Urban Ecology of Phoenix, AZ.
|

|
2142
|
AGU Press Briefing May 29th: Urban Ecology of Baltimore, MD.
|

|
2074
|
ASTER Dataset Zoom Down
|

|
2070
|
ASTER Dataset Flyover
|

|
1118
|
Terra First Light Visualizations: North America
|
CERES (Clouds and Earth's Radiant Energy System) on Terra
|
|
The CERES instrument aboard many Earth-orbiting satellites records the flow of reflected Solar radiation and reprocessed longwave radiation in the Earth's radiation budget.
|
|
Movie
|
ID
|
Title
|
|
|
3355
|
A Short Tour of the Cryosphere
|
|
|
3181
|
A Tour of the Cryosphere
|

|
2328
|
Terra/CERES View of the Earth
|

|
2231
|
Aerosols and Warming Change with Time - Version 2
|

|
2230
|
The Impact of Aerosols on Atmospheric Warming - Version 2
|

|
2215
|
Aerosols and Warming Change with Time - Version 1
|

|
2214
|
The Impact of Aerosols on Atmospheric Warming - Version 1
|

|
2174
|
Terra/CERES views the Pakistan heat wave: May 2001
|

|
2173
|
Terra/CERES views the world in Outgoing Longwave Radiation - Daily data
|

|
2172
|
Terra/CERES views the world in Reflected Solar Radiation - Daily data
|

|
2171
|
Terra/CERES Outgoing Longwave and Reflected Solar radiation-Daily data
|

|
2170
|
Terra/CERES Outgoing Longwave and Reflected Solar radiation- Boxcar Averaged
|

|
2169
|
Terra/CERES views the Americas in Outgoing Longwave Radiation - Daily data
|

|
2168
|
Terra/CERES views the Americas in Reflected Solar Radiation - Daily data
|

|
2167
|
Terra/CERES on the American Southwest: May 2001
|

|
2159
|
14-Day Boxcar averaged Terra/CERES (Outgoing Longwave Radiation)
|

|
2158
|
14-Day Boxcar averaged Terra/CERES (Reflected Solar Radiation)
|

|
2157
|
One Year of Terra/CERES data (Outgoing Longwave Radiation) Daily data
|

|
2156
|
One Year of Terra/CERES data (Reflected Solar Radiation) Daily data
|

|
1144
|
Spinning Global Shortwave from CERES
|

|
1143
|
Spinning Global Longwave from CERES
|

|
1142
|
Shortwave from CERES Unwrapped
|

|
1141
|
Global Shortwave from CERES
|

|
1140
|
Longwave Radiation from CERES Unwrapped
|

|
1139
|
Global Longwave from CERES
|

|
1138
|
CERES to MISR Sequence
|

|
1137
|
CERES Flat Map
|

|
1136
|
CERES Globe
|

|
1130
|
Terra: Focus on INDOEX (Second Version)
|

|
1129
|
Focus on INDOEX (First Version)
|
|
|
1118
|
Terra First Light Visualizations: North America
|
Terra-MISR
|
|
Movie
|
ID
|
Title
|

|
3127
|
Pine Island Glacier Calving (WMS)
|
|
|
2854
|
Multisensor Fire Observations without Labels (HD Version)
|
|
|
2853
|
Multisensor Fire Observations with Labels (HD Version)
|
|
|
2806
|
Multisensor Fire Observations without Labels
|
|
|
2707
|
Multisensor Fire Observations
|

|
2344
|
Pine Island Iceberg Formation
|
|
|
1138
|
CERES to MISR Sequence
|
|
|
1118
|
Terra First Light Visualizations: North America
|
Terra-MODIS
|
|
|
Movie
|
ID
|
Title
|

|
3546
|
Examining Hurricane Gustav's Cloud Structure
|

|
3539
|
BlueMarble Next Generation Images from Terra/MODIS
|

|
3523
|
Seasonal Landcover for Science-on-a-Sphere
|

|
3510
|
MODIS Sea Surface Temperature from 2002 to 2006 around Australia
|

|
3506
|
Surface Temperature of the Greenland Ice Sheet During the Summer of 2005
|

|
3467
|
Updated Jakobshavn Glacier Calving Front Retreat from 2001 through 2006 with Blue/White Elevation Change over Greenland
|

|
3434
|
Updated Jakobshavn Glacier Calving Front Retreat from 2001 through 2006
|

|
3430
|
Ayles Ice Shelf Breakup Viewed from Northwest Coastline
|

|
3429
|
Ayles Ice Shelf Breakup Viewed from Overhead
|

|
3419
|
NAMMA Aircraft Flights from Cape Verde
|

|
3418
|
Sample LIMA Data versus MOA Data of Ross Island
|

|
3417
|
Sample LIMA Data versus MOA Data of McMurdo Station
|

|
3416
|
Sample LIMA Data versus MOA Data of the Area Surrounding McMurdo Station
|

|
3415
|
Sample LIMA Data versus MOA Data of Koettlitz Glacier
|

|
3414
|
Sample LIMA Data versus MOA Data of Ferrar Glacier
|

|
3404
|
Global Rotation showing Seasonal Landcover and Arctic Sea Ice
|

|
3403
|
Antarctic Plumbing: Lake Englehardt's Subglacial Hydraulic System
|

|
3402
|
Global View of the Arctic and Antarctic on September 21, 2005
|

|
3401
|
Ayles Ice Shelf Breakup in Arctic
|

|
3390
|
AMSR-E Sea Surface Temperature
|

|
3389
|
MODIS Sea Surface Temperature Highlighting the Gulf Stream (2002 to 2006)
|

|
3388
|
MODIS Sea Surface Temperature from 2002 to 2006
|

|
3383
|
Sequence of Clouds, Snow Cover, Sea Ice, Sea Surface Temperature and Biosphere
|

|
3381
|
Great Zoom out of Chicago, IL: The Adler Planetarium
|

|
3380
|
Great Zoom into Chicago, IL: The Adler Planetarium
|

|
3379
|
Arrange for Change Poster
|

|
3373
|
Zoom from Jakobshavn Glacier with AMSR-E Daily Sea Ice and MODIS Daily Snow Cover
|

|
3372
|
Loop of AMSR-E Daily Arctic Sea Ice from Aug 2005 to Aug 2006
|
|
|
3355
|
A Short Tour of the Cryosphere
|

|
3353
|
Terra/Aqua MODIS: Snow Cover and Sea Ice Surface Temperature
|

|
3351
|
MODIS Sea Surface Temperature around the Australian Continent
|

|
3334
|
Zoom to the Meteor Crater, Arizona
|

|
3332
|
Deriving the Tamarisk Suitability Map: The Complete Story
|

|
3331
|
Creating the Tamarisk Habitat Suitability Map (for Science Presentations)
|

|
3330
|
Creating the Tamarisk Habitat Suitability Map (for General Use)
|

|
3319
|
MODIS Mosaic of Antarctica sees the Ross Ice Shelf without ICESat Topography
|

|
3318
|
MODIS Mosaic of Antarctica view of Pine Island and Thwaites Glacier without ICESat Topography
|

|
3305
|
McMurdo Sound Flows Easy
|

|
3304
|
Antarctic Iceberg Breaks Apart
|

|
3302
|
Hurricane Wilma MODIS Progression
|

|
3300
|
Habitat Suitability for Tamarisk Invasion in the State of Colorado
|

|
3299
|
Habitat Suitability for Tamarisk Invasion in the State of California
|

|
3298
|
Habitat Suitability for Tamarisk Invasion in the State of Nevada
|

|
3297
|
Habitat Suitability for Tamarisk Invasion in the State of Arizona
|

|
3296
|
Habitat Suitability for Tamarisk Invasion in the State of Utah
|

|
3295
|
MODIS Mosaic of Antarctica sees the Ross Ice Shelf
|

|
3293
|
The Habitat Suitability for Tamarisk Invasion in the State of New Mexico
|

|
3292
|
Habitat Suitability for Tamarisk Invasion in the State of Texas
|

|
3291
|
National Map Showing Habitat Suitability for Tamarisk Invasion
|

|
3285
|
Hurricane Wilma MODIS Close-Up
|

|
3278
|
Seasonal Landcover Change over Eastern Asia in 2004
|

|
3277
|
Seasonal Landcover Change over the Nile Delta in 2004
|

|
3273
|
2004 Global Vegetation from Blue Marble Next Generation
|

|
3272
|
Global Seasonal Landcover in 2004
|

|
3271
|
Seasonal Landcover Change over the Eastern United States
|

|
3270
|
Seasonal Landcover Change over the Alps
|

|
3269
|
Seasonal Landcover Change over Western Asia in 2004
|

|
3261
|
Hurricane Rita Sea Surface Temperature and Clouds
|

|
3246
|
Hurricane Ophelia
|

|
3240
|
Hurricane Katrina Sea Surface Temperature (WMS)
|

|
3238
|
Progression of Hurricane Katrina, 2005 (WMS)
|

|
3224
|
Hurricane Katrina Progression
|

|
3222
|
Hurricane Katrina Sea Surface Temperature
|

|
3200
|
Progression of Hurricane Emily, 2005 (WMS)
|

|
3196
|
Hurricane Dennis
|

|
3195
|
The Cave Creek Complex Fire near Phoenix, Arizona
|

|
3194
|
Progression of Hurricane Dennis, 2005 (WMS)
|

|
3183
|
Great Zoom into the Houston Museum of Natural Science
|
|
|
3181
|
A Tour of the Cryosphere
|

|
3180
|
MODIS Daily Global Snow Cover and Sea Ice Surface Temperature as seen in the SIGGRAPH 2005 Electronic Theater
|

|
3158
|
Progression of Hurricane Fabian, 2003 (WMS)
|

|
3153
|
Progression of Hurricane Charley, 2004 (WMS)
|

|
3151
|
Progression of Hurricane Ivan, 2004 (WMS)
|

|
3147
|
Progression of Hurricane Frances, 2004 (WMS)
|

|
3139
|
Hurricane Isabel 2003 Progression Images
|

|
3123
|
Larsen Ice Shelf Collapse (WMS)
|

|
3118
|
Great Zoom out from Kodak Theater with spin (Los Angeles, CA)
|

|
3117
|
Great Zoom into Kodak Theater with spin (Los Angeles, CA)
|

|
3087
|
Long Island Size Iceberg Collides with Ice Sheet
|

|
3086
|
Antarctic Iceberg Breaks Up Ice Sheet
|

|
3085
|
Sea Ice Held Captive Gets Break
|

|
3084
|
Snap! Crackle! POP! Goes the Iceberg!
|

|
3081
|
Giant Iceberg in McMurdo Sound (WMS)
|

|
3080
|
Long Island Size Iceberg Blocks Penguins Feeding Grounds
|

|
3079
|
Long Island Size Iceberg Slows Shipping Lanes
|

|
3078
|
Iceberg Slows Shipping Lanes to McMurdo Station
|

|
3075
|
Biomass Burning over South America
|

|
3037
|
Sea Ice Surface Temperature with Regions of No Data Indicated (WMS)
|

|
3036
|
Daily Sea Ice Surface Temperature 2002-2003 (WMS)
|

|
3035
|
Progression of Hurricane Jeanne, 2004 (WMS)
|

|
3027
|
Snow Cover over North America during the Winter of 2001-2002 (WMS)
|

|
3021
|
Hurricane Jeanne Crashes into Florida
|

|
3020
|
Up Close and Personal with Hurricane Jeanne
|

|
3019
|
Hurricane Jeanne's Progression with a Fixed View
|

|
3018
|
A Fixed View of Hurricane Jeanne's Progression
|

|
3017
|
Hurricane Jeanne on September 23, 2004
|

|
3015
|
A Fixed View of Hurricane Ivan
|

|
3007
|
Hurricane Ivan Progression as Seen by MODIS September 9-14, 2004
|

|
3006
|
Hurricane Ivan Progression with Fixed View
|

|
3005
|
Hurricane Ivan Progression
|

|
3004
|
Hurricane Ivan Closes in on Jamaica
|

|
2999
|
MODIS Data May Aid EPA Air Quality Predictions (Tight)
|

|
2998
|
MODIS Data May Aid EPA Air Quality Predictions (Wide)
|

|
2994
|
Flying Along with Hurricane Frances
|

|
2992
|
Hurricane Frances Progression with a Fixed View
|

|
2985
|
Daily Snow and Sea Ice Temperature over Asia
|

|
2984
|
Daily Snow and Sea Ice Temperature over Europe
|

|
2983
|
Daily Snow and Sea Ice Temperature over North America
|

|
2982
|
Daily Snow and Sea Ice Temperature over the North Pole
|

|
2981
|
Global Daily Snow and Sea Ice Surface Temperature
|

|
2977
|
Hurricane Frances Progression with Fixed View
|

|
2976
|
Examining Hurricane Frances' Cloud Structure
|

|
2975
|
Hurricane Frances on September 1, 2004
|

|
2974
|
Hurricane Frances Progression
|

|
2969
|
Glaciers Spur Alaskan Earthquakes
|

|
2951
|
Super Typhoon Nida
|

|
2943
|
Canadian Smoke Invades the East Coast
|

|
2935
|
Mission Proposal: Polar GOES-like spacecraft (riding the spacecraft - animated swaths)
|

|
2934
|
Mission Proposal: Polar GOES-like spacecraft (riding the spacecraft - animated clouds)
|

|
2933
|
Mission Proposal: Polar GOES-like spacecraft (beauty shot)
|

|
2932
|
Daily Snow over North America 2002-2003 without Permafrost Map
|

|
2925
|
Daily Snow over North America 2002-2003 with Permafrost Map
|

|
2919
|
Progression of Hurricane Isabel, 2003 (WMS)
|

|
2915
|
Blue Marble - A Seamless Image Mosaic of the Earth (WMS)
|

|
2899
|
Snow Cover over the Northern Hemisphere during the Winter of 2002-2003 (WMS)
|

|
2897
|
Cold Water Trails from Hurricanes Fabian and Isabel (WMS)
|

|
2890
|
African Fires during 2002 (WMS)
|

|
2888
|
Great Zoom into Houston, Texas: Reliant Stadium
|

|
2887
|
Great Zoom out of Houston, Texas: Reliant Stadium
|

|
2886
|
Great Zoom into Houston, Texas: Reliant Stadium (with spin)
|

|
2885
|
Great Zoom out of Houston, Texas: Reliant Stadium (with spin)
|

|
2874
|
Great Zoom into Don Juan Pond, Antarctica (treatment #2)
|

|
2873
|
Great Zoom into Don Juan Pond, Antarctica (treatment #1)
|

|
2872
|
Earth-Mars Volcano Comparisons: Mars inside a transparent Earth
|

|
2871
|
Earth-Mars Volcano Comparisons: Transparent Olympus Mons over Elevation Color-Mapped Earth with True Color Land
|

|
2870
|
Earth-Mars Volcano Comparisons: True Color Olympus Mons over Elevation Color-Mapped Earth Bathymetry with True Color Land Features
|

|
2867
|
Earth-Mars Volcano Comparisons: Elevation color-mapped Earth with True Color Land
|

|
2866
|
Earth-Mars Volcano Comparisons: Earth with Elevation Color Map
|

|
2865
|
Earth-Mars Volcano Comparisons: True Color Earth
|

|
2864
|
Earth-Mars Volcano Comparisons: Final Composite
|

|
2858
|
California Fires MODIS imagery and TOMS Aerosols from October 2003
|
|
|
2854
|
Multisensor Fire Observations without Labels (HD Version)
|
|
|
2853
|
Multisensor Fire Observations with Labels (HD Version)
|

|
2852
|
2003 California Fire Sequence as Seen by MODIS
|

|
2851
|
Mapping Invasive Species Using MODIS Time Series Data
|

|
2847
|
California Fires w/o Fire Pixels
|

|
2846
|
California Fires with Fire Pixels
|

|
2843
|
Southern California Fires, Oct 26, 2003 (Western View of Smoke)
|

|
2842
|
Southern California Fires, Oct 26, 2003
|

|
2825
|
Hurricane Isabel Progresssion as Seen by MODIS
|

|
2824
|
Cold Water Trails from Hurricanes Fabian and Isabel
|

|
2823
|
Hurricanes Fabian and Isabel from GOES
|

|
2821
|
Recipe of a Hurricane - Spin Around Clouds and Isosurfaces
|

|
2820
|
Recipe of a Hurricane (Part 2) -- Clouds and Isosurfaces (match rendered)
|

|
2819
|
Recipe of a Hurricane (Part 2) - Push into Blue Marble (match rendered)
|

|
2812
|
Fires in Montana
|

|
2811
|
Fires in Montana (with Fire Pixels)
|
|
|
2806
|
Multisensor Fire Observations without Labels
|

|
2805
|
Hurricane Isabel Eyes the Eastern U.S., September 15, 2003
|

|
2801
|
Tracking the Category 5 Hurricane Isabel, September 11, 2003
|

|
2792
|
Typhoon Etau
|

|
2791
|
Time Series of the Biscuit Fire with Smoke
|

|
2790
|
Time Series of the Biscuit Fire
|

|
2782
|
GPM Earth Spin Animation
|

|
2781
|
GPM Nile River Animation
|

|
2776
|
Aspen Fire, Arizona
|

|
2775
|
Zoom to the Aspen Fire, Arizona on June 24, 2003
|

|
2774
|
A Time Series of the Aspen Fire North of Tucson, Arizona from June 19 - 24, 2003
|

|
2773
|
A Time Series of the Aspen, Arizona Fire from June 19 - 24, 2003 (offset view)
|

|
2772
|
Zoom to the Aspen Fire, Arizona on June 19, 2003
|

|
2770
|
Smoke from Colorado Fires - Jun 2002
|

|
2769
|
Smoke from Colorado Fires - Jun 2002
|

|
2768
|
Smoke from Oregon Fires - Aug 2002
|

|
2767
|
Smoke from Oregon Fires - Aug 2002
|

|
2749
|
Great Zoom into Tucson, AZ: Sabino Canyon
|

|
2747
|
ICESat First Light Release: Following ICESat
|

|
2746
|
ICESat First Light Release: A Global Perspective
|

|
2745
|
ICESat First Light Release: Antarctica in Three Dimensions
|

|
2744
|
ICESat First Light Release: A Continuous View of Clouds
|

|
2743
|
ICESat First Light Release: A Closer View of the Coast
|

|
2742
|
ICESat First Light Release: From Sea Ice to Ice Streams
|

|
2741
|
ICESat First Light Release: Antarctica, from Coast to Coast
|

|
2740
|
Ice Covers the Great Lakes
|

|
2733
|
Great Zoom into the Kodak Theater with spin(Los Angeles, CA)
|

|
2732
|
Great Zoom out from the Kodak Theater (Los Angeles, CA)
|

|
2731
|
Great Zoom into the Kodak Theater (Los Angeles, CA)
|

|
2730
|
Great Zoom out from GWU
|

|
2729
|
Great Zoom into GWU
|

|
2728
|
Great Zoom out of Siberia
|

|
2727
|
Great Zoom into Siberia
|

|
2726
|
Comparison of Snow Cover over the USA during the Winters of 2001/2002 and 2002/2003
|

|
2725
|
Snow Cover over the USA during the Winter of 2002/2003
|

|
2724
|
Snow Cover over the USA during the Winter of 2001/2002
|

|
2709
|
Rotating Bluemarble Globe with Clouds
|

|
2708
|
Rotating Bluemarble Globe
|
|
|
2707
|
Multisensor Fire Observations
|

|
2706
|
African Dust Sequence
|

|
2705
|
Terra/Aqua Snow Sequence January/February 2003
|

|
2703
|
Seasonal Ice Flow Backed Up
|

|
2702
|
Snow Covers Northeastern United States on February 20, 2003
|

|
2688
|
Apollo 17 30th Anniversary: Blue Marble Great Barrier Reef Fly-over
|

|
2687
|
Apollo 17 30th Anniversary: Blue Marble Italian Fly-over
|

|
2686
|
Apollo 17 30th Anniversary: Blue Marble Himalayan Fly-over
|

|
2685
|
Apollo 17 30th Anniversary: Andes Flyover
|

|
2684
|
Apollo 17 30th Anniversary: Blue Marble European Fly-over
|

|
2683
|
Apollo 17 30th Anniversary: Blue Marble Drift-in
|

|
2673
|
Great Zoom out from Boston, MA: Park Plaza Hotel
|

|
2672
|
Great Zoom into Boston, MA: Park Plaza Hotel
|

|
2671
|
Great Zoom out from New Orleans, LA: The Louisiana Superdome (masks visible)
|

|
2670
|
Great Zoom into New Orleans, LA: The Louisiana Superdome (masks visible)
|

|
2669
|
Great Zoom out of New Orleans, LA: The Louisiana Superdome (b-roll)
|

|
2668
|
Great Zoom into New Orleans, LA: The Louisiana Superdome (b-roll)
|

|
2667
|
Great Zoom Mosaic - Zoom Out
|

|
2666
|
Great Zoom Mosaic - Zoom In
|

|
2665
|
Great Zoom into the Grand Canyon, AZ
|

|
2664
|
Great Zoom out of the Grand Canyon, AZ
|

|
2663
|
Great Zoom into Channel Islands, CA (Anacapa Island)
|

|
2662
|
Great Zoom out of Channel Islands, CA (Anacapa Island)
|

|
2654
|
Tropical Storm Edouard
|

|
2650
|
Apollo 17 30th Anniversary: Land Classification
|

|
2649
|
Apollo 17 30th Anniversary: View of the Earth's Surface
|

|
2643
|
Mt. Etna Erupts and Terra/MODIS Captures It
|

|
2640
|
Haitian Deforestation
|

|
2639
|
Fires over Central America during 2001 and 2002 with Clock
|

|
2638
|
Fires over Central America during 2001 and 2002
|

|
2633
|
Looking Down at the Earth from Space with SeaWiFS False Color Oceans.
|

|
2632
|
Looking at our World from Space
|

|
2631
|
Looking Down at the Earth from Space
|

|
2630
|
Looking down at the Earth's Ocean Floor from Space.
|

|
2618
|
Tropical Depression Kyle, October 10, 2002
|

|
2572
|
Southeastern Texas Floods: 8 July 2002 (after)
|

|
2571
|
Southeastern Texas Floods: 24 June 2002 (before)
|

|
2564
|
Progression of the West Nile Virus Through the Continental United States
|

|
2560
|
Flooding in China (Before and After)
|

|
2551
|
Great Zoom out of the Amazon, Brazil
|

|
2550
|
Great Zoom into the Amazon, Brazil
|

|
2549
|
Great Zoom into Baltimore, MD: Convention Center
|

|
2548
|
Great Zoom out of Baltimore, MD: Convention Center
|

|
2547
|
Portrait of Global Fires with Zoom to Rodeo/Chediski Fire with Clock
|

|
2546
|
Portrait of Global Fires with Zoom to Rodeo/Chediski Fire
|

|
2545
|
Fires over Australia during 2001 and 2002 with Clock
|

|
2544
|
Fires over Australia during 2001 and 2002
|

|
2543
|
Fires over Africa during 2001 and 2002 with Clock
|

|
2542
|
Fires over Africa during 2001 and 2002
|

|
2541
|
Fires over Asia during 2001 and 2002 with Clock
|

|
2540
|
Fires over Asia during 2001 and 2002
|

|
2539
|
Fires over Europe during 2001 and 2002 with Clock
|

|
2538
|
Fires over Europe during 2001 and 2002
|

|
2537
|
Fires over South America during 2001 and 2002 with Clock
|

|
2536
|
Fires over South America during 2001 and 2002
|

|
2535
|
Fires over North America during 2001 and 2002 with Clock
|

|
2534
|
Fires over North America during 2001 and 2002
|

|
2533
|
Fires over the United States during the Summer of 2002 with Clock
|

|
2532
|
Fires over the United States during the Summer of 2002
|

|
2531
|
Fires over the Western US during 2002 with Still Camera and Clock
|

|
2530
|
Fires over the Western US during 2002 with Still Camera
|

|
2529
|
Fires over the Western US during 2002 with Zoom and Clock
|

|
2528
|
Fires over the Western US during 2002 with Zoom
|

|
2527
|
Annual Portrait of Global Fires during 2001 and 2002 on a Flat Map with Clock
|

|
2526
|
Annual Portrait of Global Fires during 2001 and 2002 on a Flat Map
|

|
2525
|
A Portrait of Global Fires during 2001 and 2002 with Clock
|

|
2524
|
A Portrait of Global Fires during 2001 and 2002
|

|
2522
|
Global Revolution of Fires during 2001 and 2002
|

|
2521
|
Terra views New York City on September 11, 2001
|

|
2508
|
Fires Near Sequoia National Forest
|

|
2503
|
SC2002 Intro
|

|
2501
|
Before the Flooding in Southeast Texas
|

|
2494
|
Terra/MODIS views fires near Sequoia National Forest
|

|
2492
|
Time Sequence of Arizona Fires
|

|
2491
|
A Pop-up of the Arizona Fires
|

|
2488
|
MODIS Snow Cover over the Sierra Nevada Mountains
|

|
2487
|
MODIS Snow Cover over North America
|

|
2486
|
MODIS Snow Cover over Europe
|

|
2485
|
MODIS Snow Cover over Asia
|

|
2484
|
Global Snow Cover from MODIS
|

|
2483
|
Spinning MODIS Albedo
|

|
2480
|
MODIS White Sky Albedo Unwraps to False Color Albedo Flat Map
|

|
2479
|
MODIS Albedo Globe Unwraps to MODIS Albedo True Color Flat Map
|

|
2478
|
MODIS White Sky Albedo image improves Climate Modeling
|

|
2477
|
True Color MODIS Albedo image improves Climate Modeling
|

|
2476
|
A Zoom In of Arizona Forest Fires
|

|
2443
|
Great Zoom into New York, NY: Central Park
|

|
2442
|
Great Zoom out of New York, NY: Central Park
|

|
2441
|
Great Zoom into New York, NY: Battery Park
|

|
2440
|
Great Zoom out of New York, NY: Battery Park
|

|
2439
|
Great Zoom into Sabie River, Africa (EOS Land Validation Site)
|

|
2438
|
Great Zoom out of Sabie River, Africa (EOS Land Validation Site)
|

|
2437
|
Great Zoom into Mongu, Africa (EOS Land Validation Site)
|

|
2436
|
Great Zoom out of Mongu, Africa (EOS Land Validation Site)
|

|
2432
|
Sea Surface Temperature Anomaly from July 5, 2001 to March 10, 2002
|

|
2431
|
Himalayas Exaggerated (version 2.2)
|

|
2423
|
Great Zoom out of Baltimore, MD: Maryland Science Center (for the Volvo Ocean Race presentation)
|

|
2421
|
MODIS: Larsen B Ice Shelf Collapses
|

|
2418
|
AIRS Volumetric Cloud Data with Gradient Background (Fly Out)
|

|
2417
|
AIRS Volumetric Cloud Data with Gradient Background (Fly In)
|

|
2416
|
AIRS Volumetric Temperature Data with Gradient Background (Fly Out)
|

|
2415
|
AIRS Volumetric Temperature Data with Gradient Background (Fly In)
|

|
2414
|
AIRS Volumetric Cloud Data (Fly Out)
|

|
2413
|
AIRS Volumetric Cloud Data (Fly In)
|

|
2412
|
AIRS Volumetric Temperature Data (Fly Out)
|

|
2411
|
AIRS Volumetric Temperature Data (Fly In)
|

|
2401
|
A Pacific View of Sea Surface Temperature Anomaly for February 15, 2002
|

|
2400
|
A Pacific View of Sea Surface Temperature from MODIS for February 15, 2002
|

|
2399
|
A Close View of Sea Surface Temperature Anomaly for February 15, 2002
|

|
2398
|
Global Sea Surface Temperature from MODIS between July 2001 and February 2002
|

|
2390
|
Push-in to the Black Hills, South Dakota
|

|
2388
|
Wonderglobe: Brazil
|

|
2380
|
Great Zoom out of Salt Lake City, UT: Rice-Eccles Olympic Stadium (with Spin)
|

|
2379
|
Great Zoom into Salt Lake City, UT: Rice-Eccles Olympic Stadium (with Spin)
|

|
2378
|
Great Zoom out of Salt Lake City, UT: Rice-Eccles Olympic Stadium (with Spin and Night Lights)
|

|
2377
|
Great Zoom into Salt Lake City, UT: Rice-Eccles Olympic Stadium (with Spin and Night Lights)
|

|
2376
|
Great Zoom out of Salt Lake City, UT: Rice-Eccles Olympic Stadium (Straight Down)
|

|
2375
|
Great Zoom into Salt Lake City, UT: Rice-Eccles Olympic Stadium (Straight Down)
|

|
2374
|
Great Zoom out of Park City, UT
|

|
2373
|
Great Zoom into Park City, UT
|

|
2372
|
Great Zoom out of Salt Lake City, UT: The Delta Center
|

|
2371
|
Great Zoom into Salt Lake City, UT: The Delta Center
|

|
2370
|
Great Zoom out of Snow Basin, UT
|

|
2369
|
Great Zoom into Snow Basin, UT
|

|
2365
|
Great Zoom out of New Orleans, LA: The Louisiana Superdome (with Spin)
|

|
2364
|
Great Zoom into New Orleans, LA: The Louisiana Superdome (with Spin)
|

|
2363
|
Great Zoom out of New Orleans, LA: The Louisiana Superdome
|

|
2362
|
Great Zoom into New Orleans, LA: The Louisiana Superdome
|

|
2356
|
Himalayas Exaggerated (Draft)
|

|
2355
|
Cyclone Dina
|

|
2332
|
Great Zoom out of Beltsville, MD: Beltsville Agricultural Research Center
|

|
2331
|
Great Zoom into Beltsville, MD: Beltsville Agricultural Research Center
|

|
2330
|
Great Zoom out of Greenbelt, MD: NASA Goddard Space Flight Center
|

|
2329
|
Great Zoom into Greenbelt, MD: NASA Goddard Space Flight Center
|

|
2323
|
Dhaka, Bangladesh Urban Growth
|

|
2318
|
United States EVI from Summer 2000 to Spring 2001
|

|
2317
|
Global EVI from Spring to Winter
|

|
2316
|
Fraction of Photosynthetically Active Radiation for Africa September, 2000, through May, 2001
|

|
2315
|
Leaf Area Index for Africa September, 2000, through May, 2001
|

|
2285
|
Grasslands of the World
|

|
2283
|
MODIS Land Cover of Australia
|

|
2282
|
MODIS Land Cover of Asia
|

|
2281
|
MODIS Land Cover of South America
|

|
2280
|
MODIS Land Cover of Europe
|

|
2272
|
Hurricane Erin from MODIS: September 5, 2001
|

|
2266
|
MODIS Land Cover of Africa
|

|
2265
|
North America and Central America MODIS Land Cover
|

|
2264
|
Global MODIS Land Cover
|

|
2255
|
Pan and Zoom toward Earth
|

|
2254
|
Great Zoom out of Greenbelt, MD: NASA Goddard Space Flight Center
|

|
2253
|
Great Zoom into Greenbelt, MD: NASA Goddard Space Flight Center
|

|
2252
|
Great Zoom out of Washington, DC: NASA Headquarters
|

|
2251
|
Great Zoom into Washington, DC: NASA Headquarters
|

|
2250
|
Great Zoom out of Baltimore, MD: The Inner Harbor
|

|
2249
|
Great Zoom into Baltimore, MD: The Inner Harbor
|

|
2248
|
Great Zoom out of Seattle, WA: The Space Needle
|

|
2247
|
Great Zoom into Seattle, WA: The Space Needle
|

|
2246
|
Great Zoom out of Tucson, AZ: The University of Arizona Football Stadium
|

|
2245
|
Great Zoom into Tucson, AZ: The University of Arizona Football Stadium
|

|
2242
|
Terra/MODIS Zoom-in on a California Fire: August 29, 2001
|

|
2236
|
Terra/MODIS Rapid-Response Fires: Life of the Blue Complex Fire
|

|
2235
|
Terra/MODIS Rapid-Response Fires: California Fires
|

|
2234
|
Terra/MODIS Rapid-Response Fires: California Smoke Plumes
|

|
2233
|
Terra/MODIS Rapid-Response Fires: Siberian Fires
|
|
|
2231
|
Aerosols and Warming Change with Time - Version 2
|
|
|
2230
|
The Impact of Aerosols on Atmospheric Warming - Version 2
|
|
|
2215
|
Aerosols and Warming Change with Time - Version 1
|
|
|
2214
|
The Impact of Aerosols on Atmospheric Warming - Version 1
|

|
2213
|
Mt. Etna, Sicily on July 29, 2001 from Landsat 7
|

|
2212
|
Mt. Etna, Sicily on July 13, 2001 from Landsat 7
|

|
2211
|
Viewing Mt. Etna, Sicily Using Landsat-7 and MODIS
|

|
2209
|
MODIS View of Typhoon Yutu
|

|
2208
|
Mount Etna Eruption
|

|
2190
|
Great Zoom out of Cambridge, MA: Massachusetts Institute of Technology Kresge Auditorium
|

|
2189
|
Great Zoom into Cambridge, MA: Massachusetts Institute of Technology Kresge Auditorium
|

|
2188
|
Great Zoom out of Greenbelt, MD: Eleanor Roosevelt High School
|

|
2187
|
Great Zoom into Greenbelt, MD: Eleanor Roosevelt High School
|

|
2186
|
Great Zoom out of Greenbelt, MD: NASA Goddard Space Flight Center
|

|
2185
|
Great Zoom into Greenbelt, MD: NASA Goddard Space Flight Center
|

|
2141
|
White Sea Traps Seal Pups
|

|
2133
|
Capitol Zoom - SIGGRAPH 2001 Final Submission
|

|
2130
|
Great Zoom out of Boston, MA: The Bunker Hill Monument
|

|
2129
|
Great Zoom out of Long Beach, CA: The Queen Mary
|

|
2128
|
Great Zoom out of New York, NY: The World Trade Center
|

|
2127
|
Great Zoom out of San Francisco, CA: Fisherman's Wharf
|

|
2126
|
Great Zoom out of Orlando, FL: Epcot Spaceship Earth
|

|
2125
|
Great Zoom out of Chicago, IL: The Sears Tower
|

|
2124
|
Great Zoom out of Atlanta, GA: The State Capitol Building
|

|
2123
|
Great Zoom out of Los Angeles, CA: The Hollywood Sign
|

|
2122
|
Great Zoom out of Washington, DC: The US Capitol Building
|

|
2121
|
Great Zoom into Boston, MA: The Bunker Hill Monument
|

|
2120
|
Great Zoom into Long Beach, CA: The Queen Mary
|

|
2113
|
Great Zoom into New York, NY: The World Trade Center
|

|
2112
|
Great Zoom into San Francisco, CA: Fisherman's Wharf
|

|
2111
|
Great Zoom into Orlando, FL: Epcot Spaceship Earth
|

|
2110
|
Great Zoom into Chicago, IL: The Sears Tower
|

|
2109
|
Great Zoom into Atlanta, GA: The State Capitol Building
|

|
2108
|
Great Zoom into Los Angeles, CA: The Hollywood Sign
|

|
2107
|
Great Zoom into Washington, DC: the U.S. Capitol
|

|
2073
|
Tropospheric Ozone and Smoke from Earth Probe TOMS: Indonesia
|

|
2072
|
Tropospheric Ozone and Smoke from Earth Probe TOMS: Indian Ocean
|

|
2071
|
Tropospheric Ozone and Smoke from Earth Probe TOMS: Indian Ocean to Indonesia Zoom
|

|
2004
|
Indonesian Tropospheric Ozone and Aerosol Index
|

|
2002
|
Terra/MODIS Views Flooding in Vietnam
|

|
1324
|
DC Pan and Zoomout Animation
|

|
1165
|
Western Fires from Terra/MODIS
|
|
|
1138
|
CERES to MISR Sequence
|
|
|
1137
|
CERES Flat Map
|
|
|
1136
|
CERES Globe
|

|
1132
|
South American Cirrus Clouds
|

|
1131
|
Larsen Clouds
|
|
|
1130
|
Terra: Focus on INDOEX (Second Version)
|
|
|
1129
|
Focus on INDOEX (First Version)
|

|
1128
|
Cloud Optical Thickness Effective Particle Radius
|

|
1127
|
Chlorophyll in the Bay of Bengal with Fluorescence
|

|
1126
|
Global Sea Surface Temperature and MODIS
|

|
1125
|
Global Sea Surface Temperature and NDVI
|

|
1124
|
Global Sea Surface Temperature Without Land
|

|
1123
|
Global Vegetation Index
|

|
1122
|
A Comparison of MODIS with AVHRR
|

|
1121
|
Global Surface Reflectance (MODIS)
|

|
1120
|
First Light Image from MODIS (second draft)
|

|
1119
|
First Light Image from MODIS (first draft)
|
|
|
1118
|
Terra First Light Visualizations: North America
|

|
10001
|
Sensor Web: Smart Satellites
|
Terra-MOPITT
|
|
Movie
|
ID
|
Title
|

|
2900
|
Global Atmospheric Carbon Monoxide in 2000 (WMS)
|

|
2651
|
Apollo 17 30th Anniversary: Carbon Monoxide
|

|
2154
|
Terra/MOPITT CO Western Fires
|

|
2153
|
Terra/MOPITT CO South Atlantic Transport
|

|
2152
|
Terra/MOPITT CO North America
|

|
2151
|
Terra/MOPITT CO Pacific Transport
|

|
2150
|
Terra/MOPITT CO Full Earth
|

|
2149
|
Terra/MOPITT CO 3D Globe
|
|
|
1138
|
CERES to MISR Sequence
|
|
|
1137
|
CERES Flat Map
|
|
|
1136
|
CERES Globe
|

|
1135
|
MOPITT Globe Unwrap with Zoom into TRMM Fire Data
|

|
1134
|
MOPITT Globe Unwrap
|

|
1133
|
MOPITT Globe
|
|
|
1130
|
Terra: Focus on INDOEX (Second Version)
|
|
|
1129
|
Focus on INDOEX (First Version)
|