Skip all navigation and jump to content Jump to site navigation Jump to section navigation.
NASA Logo - Goddard Space Flight Center + Visit NASA.gov
HOME PROJECTS RESOURCES SEARCH MAP

+ Advanced Search
Home
Home
View Most Recently Released Imagery
View Gallery of Imagery: A topical collection of SVS Imagery
Search Imagery by the keywords assigned to it
Search Imagery by the instruments that supplied data for a visualization product
Search Imagery by the series of visualizations that have been produced
Search Imagery by the scientist providing the data used in a visualization product
Search Imagery by the animator that created the product
Search Imagery by the identification number assigned to the visualization product
See other search options
Learn about the SVS Image Server
  + About the Server
  + Animation List
  + How to Use the Server


  + RSS Feeds
blank image
Previous Animation
Next Animation
AMSR-E Sea Surface Temperature

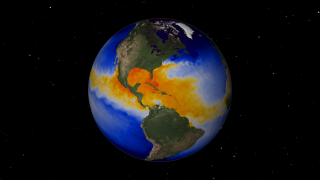
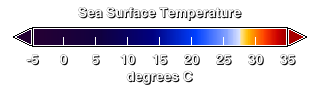
This animation is part of an NSF-funded, international project, Exploring Time. The two-hour television special, broadcast on the Discovery Channel in the spring of 2007, explores how the world changes over different timescales ... from billionths of seconds to billions of years. This animation portrays a 3-day moving average of AMSR-E sea surface temperature (SST) over the western hemisphere from the beginning of 2005 to early December, 2006. In addition, seasonal MODIS land cover shows the advance and retreat of snow over the northern hemisphere.

This program was also broadcast in Japan through a partnership with the NHK international broadcasting service and in France through a partnership with the ARTE television network.


This animation shows AMSR-E sea surface temperature and MODIS seasonal landcover from the beginning of 2005 to December, 2006.    This animation shows AMSR-E sea surface temperature and MODIS seasonal landcover from the beginning of 2005 to December, 2006.
Duration: 11.0 seconds
Available formats:
  1280x720 (29.97 fps) Frames
  512x288 (29.97 fps) MPEG-1   2 MB
  1280x720 (29.97 fps) MPEG-2   9 MB
  640x360 (29.92 fps) MPEG-4   2 MB
  1280x720 (29.97 fps) MPEG-4   9 MB
  1280x720 (59.94 fps) Frames
  320x180     PNG           32 KB
  160x80       PNG           10 KB
  80x40         PNG           3 KB
How to play our movies


This is the color scale used for the sea surface temperature, ranging from dark blue for areas below 15 degrees Celsius to dark red for regions above 35 degrees Celsius.
   This is the color scale used for the sea surface temperature, ranging from dark blue for areas below 15 degrees Celsius to dark red for regions above 35 degrees Celsius.

Available formats:
  320 x 90           PNG 9 KB

Animation Number:3390
Animators:Cindy Starr (SVS) (Lead)
 Alex Kekesi (SVS)
 Greg Shirah (SVS)
Completed:2006-12-06
Scientists:David Adamec (NASA/GSFC)
 Jeff Halverson (JCET UMBC)
 Scott Braun (NASA/GSFC)
 Owen Kelley (George Mason University)
Instruments:Aqua/AMSR-E
 Terra/MODIS
Data sets:Sea Surface Temperature
 Blue Marble Next Generation Seasonal Landcover
Data Collected:2005-01-01 to 2006-12-04
Keywords:
SVS >> HDTV
DLESE >> Physical oceanography
SVS >> Sea Surface Temperature
GCMD >> EARTH SCIENCE >> Oceans
GCMD >> EARTH SCIENCE >> Oceans >> Ocean Temperature
GCMD >> EARTH SCIENCE >> Oceans >> Ocean Temperature >> Sea Surface Temperature
GCMD >> EARTH SCIENCE >> Oceans >> Ocean Temperature >> Water Temperature
 
 
Please give credit for this item to
NASA/Goddard Space Flight Center Scientific Visualization Studio
The Blue Marble data is courtesy of Reto Stockli (NASA/GSFC).


Back to Top

USA.gov logo - the U.S. Government's official Web portal. + Privacy Policy and Important Notices
+ Reproduction Guidelines
NASA NASA Official:
SVS Contact:
Curator: