Antarctic Plumbing: Lake Englehardt's Subglacial Hydraulic System
|
ICESat satellite laser altimeter elevation profiles from 2003-2006 collected over West Antarctica reveal numerous regions of temporally varying elevation. MODIS satellite imagery over roughly the same time period collaborates where these subglacial fluctuations have occurred. These observations have led scientists to conclude that subglacial water movement is happening in this lake region, revealing a widespread, dynamic subglacial water system that could provide important insights into ice flow and the mass balance of Antarctica's ice.
|
|
|
|
This animation begins by showing the Antarctic continent through the eyes of the Aqua/AMSR-E sensor. As the camera approaches the Lake area we transition to the MODIS Mosaic Of Antarctica (MOA) revealing a December 2002 3-day average of MODIS data over Lake Englehardt. This then does a quick transition to a December 2005 3-day MODIS average. Next, an orange swathe of ICESat data passes over the lake and ICESat elevation data taken on October 24, 2003 is extruded from the surface eventually hovering above the December 2002 3-day MODIS average. The orange ICESat slice then morphs into ICESat elevation data taken on June 2, 2006 for this same region. As the ICESat elevation data dips, the underlying MODIS data transforms again into the December 2005 3-day average revealing the corresponding lake depression.
Duration: 29.0 seconds
Available formats:
1280x720 (59.94 fps)
Frames
320x180
PNG
64 KB
1280x720 (60 fps)
MPEG-2
37 MB
512x288 (60 fps)
MPEG-1
9 MB
1280x720 (60 fps)
MPEG-4
17 MB
How to play our movies
|
|

|
|
Antarctica the frozen continent. This shot is a combination of both Aqua/AMSR-E and MOA data.
Available formats:
2560 x 1920
TIFF
3 MB
320 x 240
PNG
76 KB
|
|
|
|
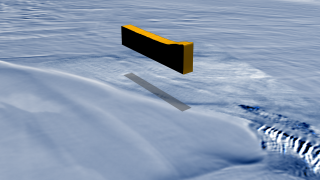
ICESat elevation data taken on October 24, 2003 is shown in orange. The underlying gray 'shadow' corresponds to where the elevation data lies on the surface. The underlying MODIS data is a 3 day average taken in the month of December 2002.
Available formats:
2560 x 1920
TIFF
3 MB
320 x 240
PNG
80 KB
|
|
|
|
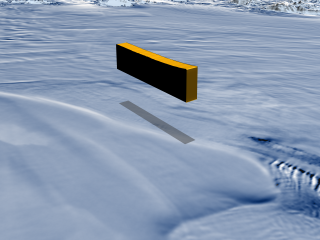
ICESat elevation data taken on June 2, 2006 is shown in orange. The underlying gray 'shadow' corresponds to where the elevation data lies on the surface. The underlying MODIS data is a 3 day average taken in the month of December 2005.
Available formats:
2560 x 1920
TIFF
3 MB
320 x 240
PNG
84 KB
160 x 80
PNG
16 KB
80 x 40
PNG
5 KB
|
|
|
Back to Top
|

