|
|
 |
Deriving the Tamarisk Suitability Map: The Complete Story
|
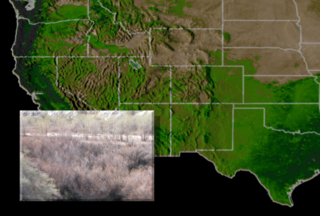
The spread of invasive species is one of the most daunting environmental, economic, and human-health problems facing the United States and the World today. It is one of several grand challenge environmental problems being addressed by NASA's Science Mission Directorate through a national application partnership with the US Geological Survey. NASA and USGS are working together to develop a National Invasive Species Forecasting System (ISFS) for the management and control of invasive species on Department of Interior and adjacent lands. The system provides a framework for using USGS's early detection and monitoring protocols and predictive models to process MODIS, ETM+, ASTER and commercial remote sensing data. It can also be used to create on-demand, regional-scale assessments of invasive species patterns and vulnerable habitats. Tamarisk (Salt Ceder) is an invasive plant that typically grows near water and crowds out native species. Tamarisk reflective properties differ from those of its neighboring vegetation throughout the annual life cycle. These different reflective properties can be seen by the naked eye (as in the accompanying seasonal photographs), and can also be seen by satellite sensors. Current Tamarisk infestations and suitable habitats for future growth can be derived from various data sets, including EVI, NDVI, and land cover classifications.
|
|
|
|
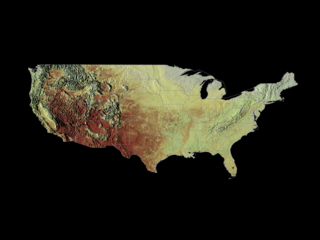
Final animation composite showing both land-based photographs of seasonal vegetation change alongside satellite data of NDVI over the United States. The animation first starts with photographs of Tamarisk at the Grand Staircase Escalante National Monument in Utah. These photos then cycle through time showing the changing seasons. They then pull away to reveal NDVI data over the western U.S. The NDVI data continues to cycle through the seasons in synchronization with the photos. Finally, the cycling NDVI data is combined with land cover classification data to create the Tamarisk suitability map.
Duration: 32.0 seconds
Available formats:
720x486 (29.97 fps)
Frames (Comp landcover)
720x486 (29.97 fps)
Frames (Comp ndvi)
720x486 (29.97 fps)
Frames (Comp photo)
640x480 (30 fps)
MPEG-1
23 MB
320x240 (30 fps)
MPEG-1
13 MB
720x486 (29.97 fps)
Frames (Comp final)
320x216
PNG
342 KB
160x80
PNG
60 KB
80x40
PNG
16 KB
640x480 (29.97 fps)
MPEG-4
22 MB
720x480 (29.97 fps)
MPEG-2
28 MB
How to play our movies
|
|

|
|
Habitat Suitability legend
Available formats:
320 x 90
PNG
9 KB
|
|
|
|
The Tamarisk Suitability Map
Available formats:
2560 x 1920
TIFF
2 MB
320 x 240
PNG
49 KB
|
| Animation Number: | 3332 |
| Animators: | Alex Kekesi (SVS) (Lead) |
| | Lori Perkins (SVS) |
| | Greg Shirah (SVS) |
| | Cindy Starr (SVS) |
| | Rich Melnick (HTSI) |
| Completed: | 2006-01-19 |
| Scientists: | Jeffrey Morisette (NASA/GSFC) |
| | Jeff Pedelty (NASA/GSFC) |
| Writer: | Elizabeth A. Smith (HTSI) |
| Instruments: | Aqua/MODIS
|
| | NOAA/AVHRR |
| | Terra/MODIS |
| Data sets: | Landcover
|
| | NDVI |
| | Tamarisk Suitability |
| | EVI |
| Data Collected: | EVI: 1/1/2001 - 12/31/2001, NDVI: 1/1/2001 - 12/31/2001, Landcover: 1/1/2001 - 7/1/2001 |
| Series: | Invasive Species Forecasting System |
Keywords:
GCMD
>> EARTH SCIENCE
>> Land Surface
>> Land Use/Land Cover
GCMD
>> EARTH SCIENCE
>> Biosphere
>> Ecological Dynamics
>> Invasive Species
GCMD
>> EARTH SCIENCE
>> Biosphere
>> Vegetation
>> Vegetation Index
GCMD
>> EARTH SCIENCE
>> Land Surface
>> Land Use/Land Cover
>> Land Use Classes
GCMD
>> Location
>> United States Of America
|
More Information on this topic available at:
http://www.nasa.gov/home/hqnews/2006/feb/HQ_06063_Invasive_species.html
http://www.nasa.gov/centers/goddard/news/topstory/2005/invasive_species.html
http://www.nasa.gov/vision/earth/environment/invasive_species.html
|
This work has been visible on
http://wjz.com/video?cid=7Kansas City InfoZine, KSL-TV (Salt Lake City), KNXV-TV (Phoenix), KUSA-TV (Denver), Richmond Times Dispatch, Space Daily, SpaceRef.com, Topix.net, WJZ-TV (Baltimore), WTVT-TV (Tampa), and Yahoo! News. |
|
Please give credit for this item to
NASA/Goddard Space Flight Center Scientific Visualization Studio |
|
Back to Top
|
|
|
|

