Tropical Cyclone Report
Tropical Depression Six
19 - 21 July 2003
Miles B. Lawrence
National Hurricane Center
18 August 2003
Tropical Depression Six formed from
a tropical wave that moved off the coast of Africa on 14 July.
Moving westward at about 20 kt, enough organized convection
developed to classify the system as a tropical depression by 19
July, at a location about 900 n mi east of the Lesser Antilles. The
depression moved westward for two days and was approaching the
Lesser Antilles on 21 July when data from a U.S. Air Force Reserve
reconnaissance aircraft indicated that the system had no closed
low-level circulation. The open tropical wave continued westward
across the Carribean for a few more days. The northern part of the
wave split off toward the northwest and developed into Tropical
Depression Seven a few days later, while located east of
Jacksonville, Florida.
Forecasts issued on 19 and 20 July
brought the depression to hurricane intensity in three days.
Watches and warnings were issued for several islands in the eastern
Caribbean Sea as listed in Table 2. Nevertheless, the depression
weakened to an open wave, bringing only a few showers across the
islands.
Table 1: Best track data for Tropical Depression Six, 19-21 July
2003.
Date/Time
(UTC) | Position | Pressure
(mb) | Wind Speed
(kt) | Stage |
Lat.
(°N) | Lon.
(°W) |
| 19 / 1800 | 12.3 | 43.5 | 1010 | 30 | tropical
depression |
| 20 / 0000 | 12.5 | 45.2 | 1010 | 30 | " |
| 20 / 0600 | 12.7 | 47.0 | 1011 | 30 | " |
| 20 / 1200 | 12.9 | 48.8 | 1011 | 30 | " |
| 20 / 1800 | 13.2 | 50.9 | 1012 | 30 | " |
| 21 / 0000 | 13.5 | 53.0 | 1012 | 30 | " |
| 21 / 0600 | 13.8 | 55.1 | 1013 | 30 | " |
| 21 / 1200 | 14.0 | 57.4 | 1012 | 30 | " |
| 21 / 1800 | | | | | dissipated |
Table 2: Watch and warning
summary for Tropical Depression Six.
| Date/Time | Action | Location |
| 20/2100 | tropical storm watch
issued | St. Lucia and
Dominca |
| 21/0300 | tropical storm warning
issued | Dominica |
| 21/0900 | tropical storm watch
issued | Puerto Rico and U.S. Virgin
Islands |
| 21/1800 | tropical storm warning
discontinued | Dominca |
| 21/1800 | tropical storm watch
discontinued | St. Lucia |
| 21/2100 | tropical storm watch
discontinued | Puerto Rico
andU.S. Virgin
Islands |

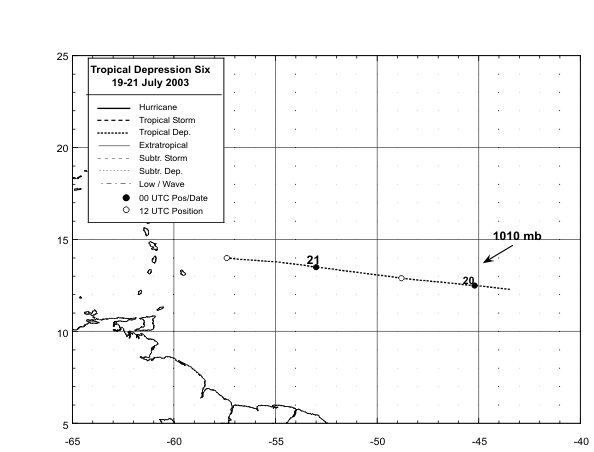
Figure 1:
Best track positions
for Tropical Depression Six, 19-21 July 2003.
|


