Tropical Cyclone Report
Hurricane Danny
16 - 21 July 2003
Stacy R. Stewart
National Hurricane Center
27 November 2003
Hurricane Danny made a large looping path over the
north central Atlantic Ocean, but did not directly affect land and
was mainly a threat to shipping.
a. Synoptic History
Danny formed from a large, well-organized tropical
wave that moved off the coast of Africa on 9 July. The highly
amplified wave, accompanied by deep convection over land and a
small low pressure system, quickly weakened and became devoid of
any thunderstorm activity as it moved westward over the cooler
waters north of 10° N latitude. The southern portion of
wave continued to move westward, while the highly amplified
northern portion remained convectively inactive as it moved
steadily northwestward for the next 3 days. Finally, on 13 July, a
large cluster of thunderstorms developed near a mid-level vorticity
center located along the wave axis. The thunderstorm activity
slowly increased and became better organized over the next couple
of days, and Dvorak satellite classifications began late on 15
July. The next day, visible satellite imagery and ship observations
indicated that a closed surface circulation developed, and it is
estimated that Tropical Depression Five had formed at 1200 UTC 16
July about 550 n mi east of Bermuda. The "best track" chart of the
tropical cyclone's path is given in Figure 1, with the wind and
pressure histories shown in Figure 2 and Figure 3,
respectively. The best
track positions and intensities are listed in Table 1.
The depression quickly developed outer convective
banding features and satellite intensity estimates indicate the
cyclone became Tropical Storm Danny at 0000 UTC 17 July when it was
located about 470 n mi east of Bermuda. For the next 24 hours,
Danny moved steadily northwestward around the western periphery of
a deep layer anticyclone before gradually turning northward and
then northeastward early on 18 July as the cyclone began to be
influenced by southwesterly upper-level winds ahead of an
approaching shortwave trough. Although Danny was located at a
relatively high latitude, the storm continued to strengthen as it
passed over a narrow region of unusually high seas-surface
temperatures (27°C - 27.5°C) late on 18 July.
By 1109 UTC 19 July, a cloud-filled eye became apparent in visible
satellite imagery (Figure 4). Danny was upgraded to hurricane status
based on the eye feature noted in visible and microwave (Figure 5)
satellite imagery, and a Dvorak satellite intensity estimate of 65
kt from all three satellite agencies - TPC/Tropical Analysis and
Forecast Branch (TAFB), Satellite Analysis Branch (SAB), and Air
Force Weather Agency (AFWA).
Since Danny had developed at an
unusually high latitude, the cyclone was embedded within a higher
than average surrounding environmental pressure field. When Danny
first became a tropical storm, its outermost closed isobar was 1024
mb - about 12 mb higher than average - and its center was located
within about 350 n mi of the center of a 1031 mb high pressure
system. This is not unprecedented and a good analog to Danny
would be Hurricane Frances of 1986. Like Danny, Hurricane Frances
developed at a fairly high latitude and within a higher than
average background surface pressure field, and remained surrounded
by above average pressures throughout its lifetime. Frances
developed an eye feature in visible satellite imagery and later
that same day a reconnaissance aircraft investigating the cyclone
found flight-level winds of 75 kt and a surface pressure of 1000 mb
(see ANNUAL SUMMARY - Atlantic Hurricane Season of 1986, Monthly
Weather Review, Volume 115, September 1987, pp. 2155-2160 -
available in PDF format from the NHC Library).
As Danny moved eastward around the northern periphery
of the nearly stationary Bermuda-Azores high pressure ridge, it
encountered moderate upper-level westerly shear, causing the
cyclone to begin a slow weakening trend late on 19 July. By early
the next day, Danny moved over cooler sea-surface temperatures,
which when combined with the increasing westerly vertical shear,
initiated rapid weakening. By 1800 UTC, Danny had turned
southeastward and had weakened back to a tropical depression. Rapid
weakening continued and Danny degenerated into a non-convective
remnant low pressure system by 0600 UTC 21 July. For the next two
days, the remnant low moved slowly southward and then westward
around the south side of the subtropical ridge before making a
small loop clockwise loop on 24-25 July about 1250 n mi
east-northeast of Bermuda. After making the loop, the remnant
circulation turned southwestward and began moving over warmer
water. Some deep convection briefly re-developed over the low-level
center for a few hours early on 26 July, but the presence of large
quantities of dry mid- to upper-level air over the system likely
prevented the thunderstorms from persisting. The remnant low
pressure system continued to moving southwestward and eventually
dissipated at 1200 UTC 27 July about 1080 n mi east of Bermuda,
which is also about 550 n mi east of where Danny originated.
b. Meteorological Statistics
Observations in Danny (Figure 2 and Figure 3)
include
satellite-based Dvorak technique intensity estimates from the
Tropical Analysis and Forecast Branch (TAFB), the Satellite
Analysis Branch (SAB) and the U. S. Air Force Weather Agency
(AFWA).
Ship MANE at 1200 UTC 20 July
2003 reported a west wind of 39 kt when it was located about 90 n
mi south of Danny.
c. Casualty and Damage Statistics
There were no reports of damages or casualties
associated with Danny.
d. Forecast and Warning Critique
Danny was a tropical cyclone for only 108 h,
resulting in a relatively small number of 96 h forecasts to verify
and no 120 h forecasts. However, average official track errors
(with the number of cases in parentheses) for Danny were 37 (17),
42 (15), 45 (13), 53 (6), 166 (7), and 290 (3) n mi for the 12, 24,
36, 48, 72, and 96 h forecasts, respectively1.
These errors are lower than the average
official track errors for the 10-yr period 1993-20022
of 45, 81, 116, 150, 225, and 282 n mi, respectively,
(Table 2).
Average official intensity errors 5, 8, 11, 15, 14, and 7 kt for the
12, 24, 36, 48,72, and 96 h forecasts, respectively, were slightly better
than average. For comparison, the average official intensity errors over the
10-yr period 1993-20023 are 6, 10, 13, 15, 19, 21, and 22 kt,
respectively.
No watches or warnings were associated with
Danny.
1All forecast verifications in this report include the
depression stage of the cyclone. National Hurricane Center verifications
presented in these reports prior to 2003 did not include the depression
stage.
2Errors given for the 96 and 120 h periods are averages
over the two-year period 2001-2002.
Table 1: Best track
data for Hurricane Danny, 16-21 July 2003
Date/Time
(UTC) | Position | Pressure
(mb) | Wind Speed
(kt) | Stage |
Lat.
(°N) | Lon.
(°W) |
| 16 / 1200 | 30.8 | 54.1 | 1017 | 25 | tropical
depression |
| 16 / 1800 | 31.7 | 54.7 | 1015 | 30 | " |
| 17 / 0000 | 32.5 | 55.2 | 1013 | 35 | tropical
storm |
| 17 / 0600 | 33.4 | 55.6 | 1011 | 45 | " |
| 17 / 1200 | 34.4 | 56.4 | 1009 | 50 | " |
| 17 / 1800 | 35.3 | 56.6 | 1008 | 55 | " |
| 18 / 0000 | 36.2 | 56.4 | 1007 | 55 | " |
| 18 / 0600 | 37.1 | 56.0 | 1006 | 55 | " |
| 18 / 1200 | 38.1 | 54.9 | 1003 | 60 | " |
| 18 / 1800 | 39.2 | 53.4 | 1002 | 65 | hurricane |
| 19 / 0000 | 40.1 | 51.7 | 1001 | 65 | " |
| 19 / 0600 | 41.1 | 50.0 | 1000 | 65 | " |
| 19 / 1200 | 42.1 | 47.8 | 1001 | 65 | " |
| 19 / 1800 | 42.7 | 45.8 | 1003 | 60 | tropical
storm |
| 20 / 0000 | 42.7 | 44.0 | 1005 | 55 | " |
| 20 / 0600 | 42.5 | 42.4 | 1007 | 45 | " |
| 20 / 1200 | 41.9 | 40.7 | 1008 | 40 | " |
| 20 / 1800 | 40.9 | 39.2 | 1009 | 30 | tropical
depression |
| 21 / 0000 | 39.8 | 37.9 | 1009 | 30 | " |
| 21 / 0600 | 38.8 | 36.8 | 1010 | 30 | remnant low |
| 21 / 1200 | 37.9 | 36.3 | 1011 | 25 | " |
| 21 / 1800 | 37.1 | 35.9 | 1013 | 25 | " |
| 22 / 0000 | 36.3 | 35.8 | 1015 | 25 | " |
| 22 / 0600 | 35.7 | 36.2 | 1017 | 25 | " |
| 22 / 1200 | 35.3 | 36.7 | 1018 | 25 | " |
| 22 / 1800 | 35.1 | 37.2 | 1019 | 25 | " |
| 23 / 0000 | 35.0 | 37.8 | 1020 | 20 | " |
| 23 / 0600 | 34.9 | 38.6 | 1020 | 20 | " |
| 23 / 1200 | 35.5 | 39.0 | 1020 | 20 | " |
| 23 / 1800 | 36.0 | 40.0 | 1020 | 20 | " |
| 24 / 0000 | 36.0 | 40.5 | 1021 | 20 | " |
| 24 / 0600 | 36.6 | 40.5 | 1021 | 20 | " |
| 24 / 1200 | 36.5 | 40.0 | 1021 | 20 | " |
| 24 / 1800 | 36.4 | 39.5 | 1021 | 20 | " |
| 25 / 0000 | 36.5 | 38.9 | 1022 | 20 | " |
| 25 / 0600 | 36.3 | 39.2 | 1022 | 20 | " |
| 25 / 1200 | 36.0 | 39.0 | 1022 | 20 | " |
| 25 / 1800 | 35.5 | 39.0 | 1022 | 20 | " |
| 26 / 0000 | 34.5 | 39.5 | 1023 | 20 | " |
| 26 / 0600 | 33.8 | 40.0 | 1023 | 20 | " |
| 26 / 1200 | 33.0 | 40.5 | 1023 | 20 | " |
| 26 / 1800 | 32.0 | 41.0 | 1023 | 20 | " |
| 27 / 0000 | 31.0 | 42.0 | 1024 | 20 | " |
| 27 / 0600 | 31.0 | 43.5 | 1024 | 20 | " |
| 27 / 1200 | | | | | dissipated |
| 19 / 0600 | 41.1 | 50.0 | 1000 | 65 | minimum pressure |
Table 2: Preliminary forecast evaluation (heterogeneous sample)
for Hurricane
Danny, 16-21 July 2003. Forecast
errors (n mi) are
followed by the number of forecasts in parentheses. Errors smaller
than the NHC official forecast are shown in bold-face
type. Verification
includes the depression stage, but does not include the
extratropical stage, if any.
| Forecast Technique | Period (hours) |
| 12 | 24 | 36 | 48 | 72 | 96 | 120 |
| CLP5 | 58 (17) | 124 (15) | 189 (13) | 224 (11) | 303 ( 7) | 383 ( 3) | |
| GFNI | 28
(13) | 50 (11) | 72 ( 9) | 119 ( 8) | 303 ( 2) | | |
| GFDI | 31
(17) | 55 (15) | 81 (13) | 121 (11) | 209 ( 6) | 297 ( 2) | |
| GFDL | 28
(16) | 49 (14) | 70 (12) | 102 (10) | 165 (
4) | | |
| LBAR | 33
(17) | 62 (15) | 91 (13) | 126 (11) | 135 (
7) | 137 (
3) | |
| AVNI | 28 (
9) | 39 (
7) | 102 ( 5) | | | | |
| AVNO | 43 (15) | 59 (11) | 64 ( 5) | 102 ( 1) | | | |
| AEMI | 19
(10) | 39 (
9) | 77 ( 8) | 116 ( 7) | 212 ( 4) | | |
| BAMD | 46 (17) | 72 (15) | 89 (13) | 116 (11) | 239 ( 7) | 319 ( 3) | |
| BAMM | 33
(17) | 46 (15) | 62 (13) | 88 (11) | 170 ( 7) | 228 (
3) | |
| BAMS | 41 (17) | 71 (15) | 101 (13) | 128 (11) | 158 (
7) | 198 (
3) | |
| NGPI | 30
(15) | 42 (13) | 50 (11) | 70 ( 9) | 128 (
5) | 477 ( 1) | |
| NGPS | 40 (16) | 49 (14) | 50 (12) | 63 (10) | 117 (
6) | 382 ( 2) | |
| UKMI | 50 (12) | 103 (10) | 126 ( 8) | 142 ( 7) | 357 ( 2) | | |
| UKM | 52 ( 8) | 82 ( 6) | 152 ( 2) | | | | |
| A98E | 45 (17) | 51 (15) | 72 (13) | 102 (11) | 207 ( 7) | 322 ( 3) | |
| A9UK | 43 ( 9) | 58 ( 8) | 67 ( 7) | 51 (
6) | 187 ( 4) | | |
| GUNS | 30
(12) | 51 (10) | 52 ( 8) | 51 (
7) | 100 (
2) | | |
| GUNA | 31 (
7) | 51 ( 5) | 71 ( 3) | | | | |
| OFCL | 37 (17) | 42 (15) | 45 (13) | 53 (11) | 166 ( 7) | 290 ( 3) | |
| NHC Official (1993-2002 mean) | 39 (2864) | 72 (2595) | 103 (2314) | 131 (2050) | 186 (1603) | 197 (210) | 223 (143) |
|

Figure 1:
Best track positions for Hurricane Danny, 16-21 July 2003.
Track positions during the remnant low stage (begins 0600 UTC 21 July)are
based on analyses from the Tropical Prediction Center's Tropical Analysis
and Forecast Branch (TAFB) and the Ocean Prediction Center (OPC).
Figure 2:
Selected wind observations and best track maximum sustained
surface wind speed curve for Hurricane Danny, 16-21 July 2003.Estimates
during the remnant low stage (begins 0600 UTC 21 July) are based on analyses
from the Tropical Prediction Center's Tropical Analysis and Forecast Branch
(TAFB)and the Ocean Prediction Center (OPC).Surface estimates indicated by
"X" after 0000 UTC 21 July are based on uncontaminated QuikSCAT
scatterometer wind data.
Figure 3:
Selected pressure observations and best track minimum
central pressure curve for Hurricane Danny, 16-21 July 2003.Estimates during
the remnant low stage (begins 0600 UTC 21 July)are based on analyses from
the Tropical Prediction Center's Tropical Analysis and Forecast Branch
(TAFB) and the Ocean Prediction Center (OPC).
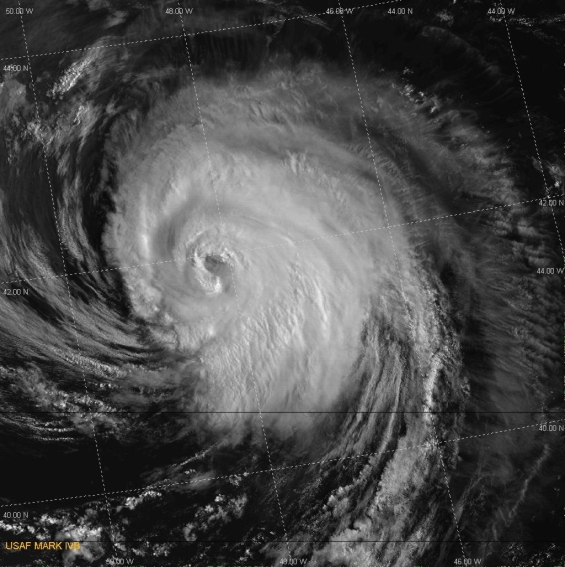
Figure 4:
U.S. Air Force Defense Meteorological Satellite Program (DMSP-F14)
visible image of Hurricane Danny, 1109 UTC 19 July 2003.
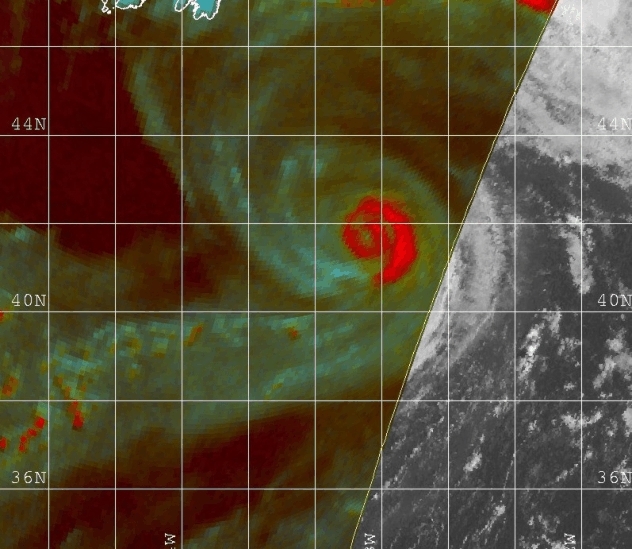
Figure 5:
DMSP Special Sensor Microwave/Imager (SSMI-F13) multispectral image of the eye
and banding features associated with Hurricane Danny, 1032 UTC 19 July 2003
(image courtesy of Naval Research Laboratory).
|


