
This page contains several visualizations which have been prepared in the
course of GFDL's research, and subsequently presented at meetings and in
the media. These are offered here not so much as scientific research results,
nor do they necessarily represent the entire spectrum of research being
conducted at GFDL, but rather as examples of various visualization techniques
and how they might be used to convey complex results as understandable images.
A number of visualizations are also available in the form of annotated
handouts.
Note:
Redistribution of these materials is permitted, but we ask that
NOAA/GFDL is credited as the source and that we are informed of the usage.
Please also see our
Disclaimers
and
Privacy Policy.
Categories |
|
| Atmosphere (Earth, Jupiter, Mars) |
|
| Climate Diagnostics | |
| Climate Prediction (Global Warming, El Niño) | |
| Hurricanes | |
| High Performance Computing | |
| Mesoscale Dynamics | |
| Oceans | |
| Animation Viewers | |
| Visual Index | Visualization Software |
Featured Visualizations
Model Generated Hurricanes | |

|
Simulated clouds and weather systems generated for a three-month period (Aug-Oct 2005) using the GFDL Zetac regional atmospheric model. |
Ozone Decline and Recovery | |

|
The animation shows the evolution of northern and southern
hemisphere ozone as simulated in the GFDL coupled chemistry-climate model.
The animation covers the period 1960 to 2100 and
shows the development and disappearance of the Antarctic ozone hole.
Animation: 1280x960 MPG (140 MB) | 640x480 MPG (65 MB) 1280x960 Quicktime (167 MB) | 640x480 Quicktime (66 MB) |
IPCC Models and Hurricanes | |
|
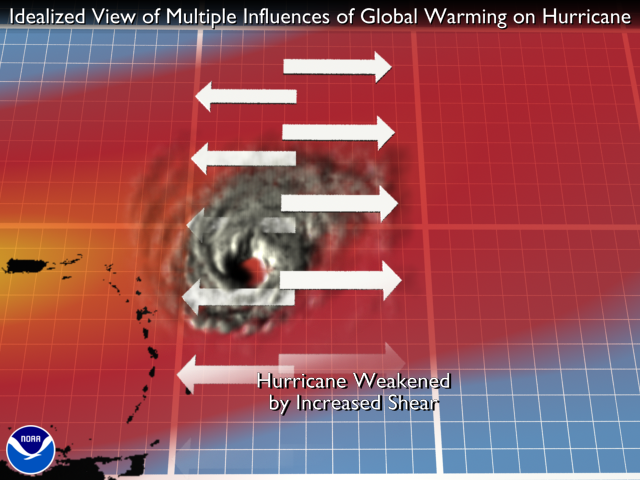
This animation illustrates the factors likely to influence
Atlantic hurricanes under CO2 induced global warming.
On the one hand, the oceans are projected to warm, increasing
the thermodynamic potential of hurricanes.
On the other hand, vertical wind shear is projected to increase,
the effect of which should be in the
opposite sense to that of the warming oceans.
Animations: QuickTime (14 MB) | WMV (12 MB) | H.264 (7 MB) |
| Atmosphere (Earth, Jupiter, Mars) | |
|---|---|
Radiative Transfer during Convection | |
|
Deep convection and its associated mesoscale circulations were modeled using the Lipps-Hemler three-dimensional cloud-system model. |
Transport Dynamics | |
|
Synthesis of the dynamics governing transport in the upper troposphere include a model that shows the nitrous oxide mixing ratio in the Southern Hemisphere. Quicktime Animation (92 Mb) |
Mars | |
|
Dust Storms and Wind/Topographic Patterns |
Jupiter's Great Red Spot | |

|
Temperature Structure of Vortex |
| Climate Diagnostics | |
|---|---|
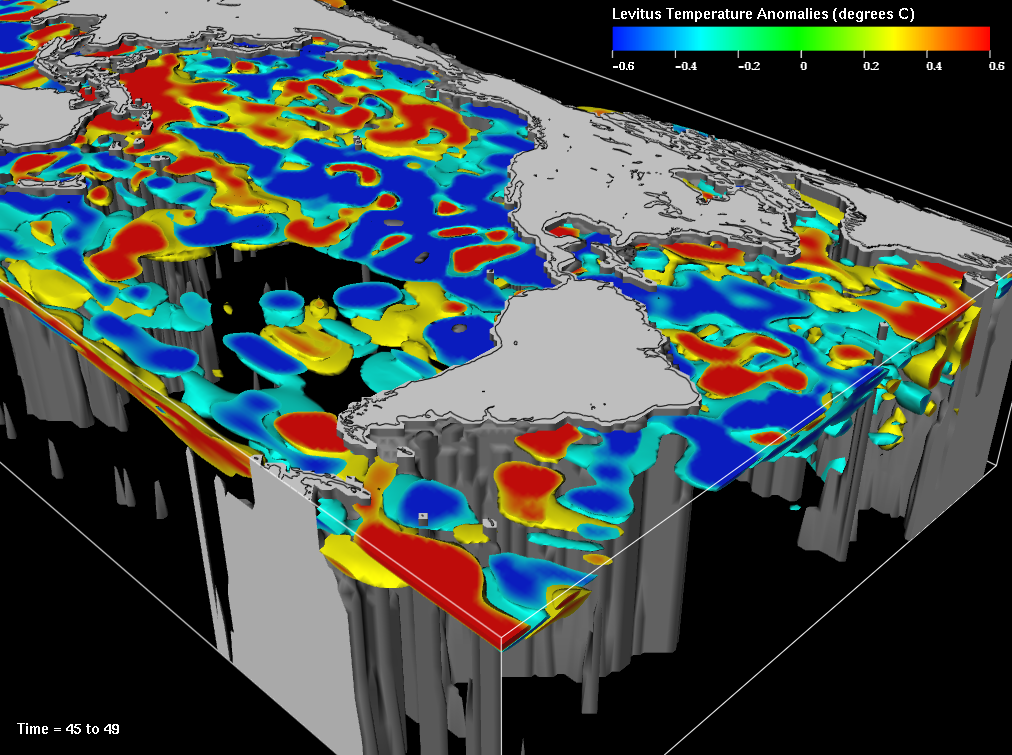
Ocean Observation and Modeling (LEVITUS) | |
|
The LEVITUS data set (left) represents objectively analyzed fields of major ocean parameters, such as temperature, at the annual, seasonal, and monthly time scales. Researchers here at GFDL/NOAA rely on such empirical results as a basis for theoretical development. |
| Climate Prediction | |
|---|---|
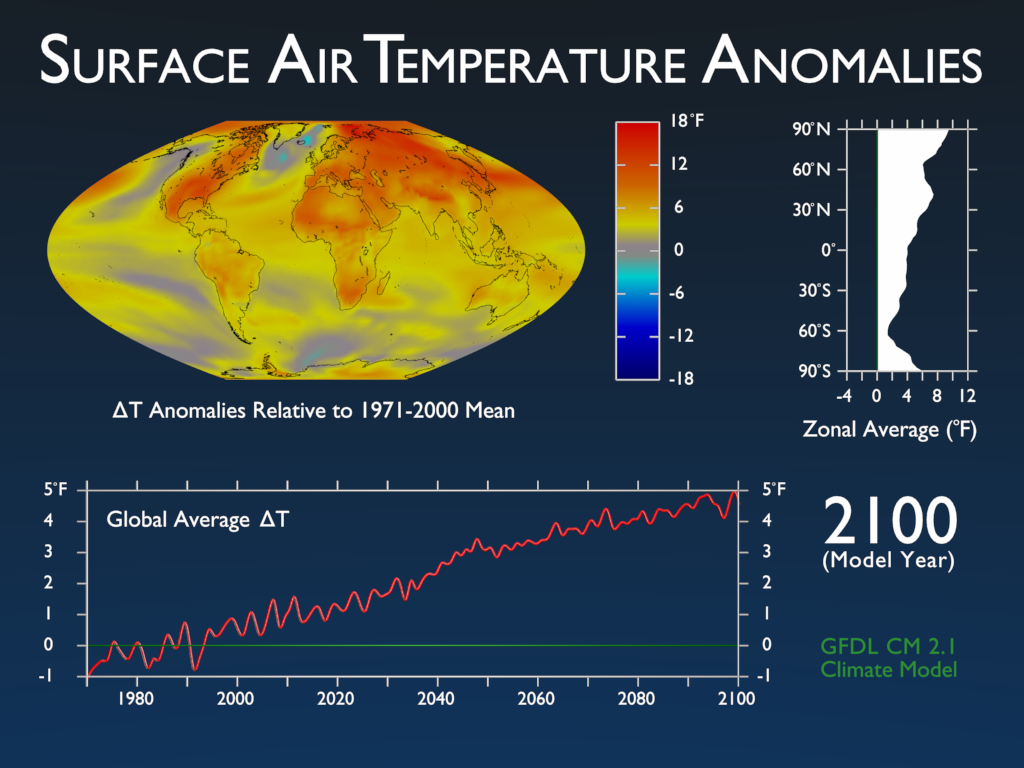
Surface Air Temperature Anomalies | |
|
Coupled Climate Model (CM 2.1) projection of
surface air temparature anomalies from years 1971-2100.
MPEG4 Animation (2.4 MB) |
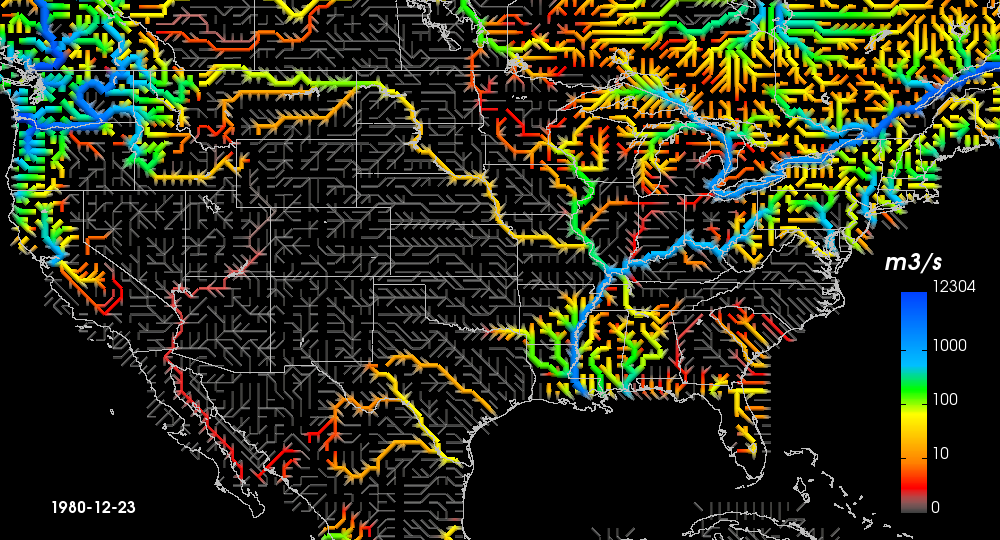
Water Flow | |
|
This animation depicts the flow of water through the river system of the
United States. Color and width of line indicates volume of flow passing a
given point per unit time.
MPEG4 Animation (20 MB) |
Hurricanes in an Enhanced CO2 Climate | |

|
See this section from a presentation given at SuperComputing '99.
Animation: AVI (5.3 Mb) | Quicktime (6.8 Mb) |
Effect of CO2 Doubling on Surface Air Temperature | |
|
Animations: 1 & 10 Year Filters MPEG (3.6 Mb), 1 & 10 Year Filters AVI (8.2 Mb), 10 Year Filter Only MPEG (1.6 Mb) |
Combined Effects of CO2 Doubling on Ocean/Atmosphere | |
|
Three-dimensional view of projected surface air temperature and ocean
warming due to greenhouse gases as calculated by a low-resolution
GFDL coupled ocean-atmosphere climate model. Read this
annotated handout
to learn more.
|
Temperature Response to Increased Atmospheric CO2 | |
|
CO2 doubling and quadrupling presented at the
"White House Conference on Global Climate Change", 6-Oct-97.
(Description)
AVI Animation (16 Mb) |
Soil Moisture Effects | |

|
In response to increasing CO2, the GFDL model projects substantial decreases in soil moisture over most mid-latitude continental areas during summer. |
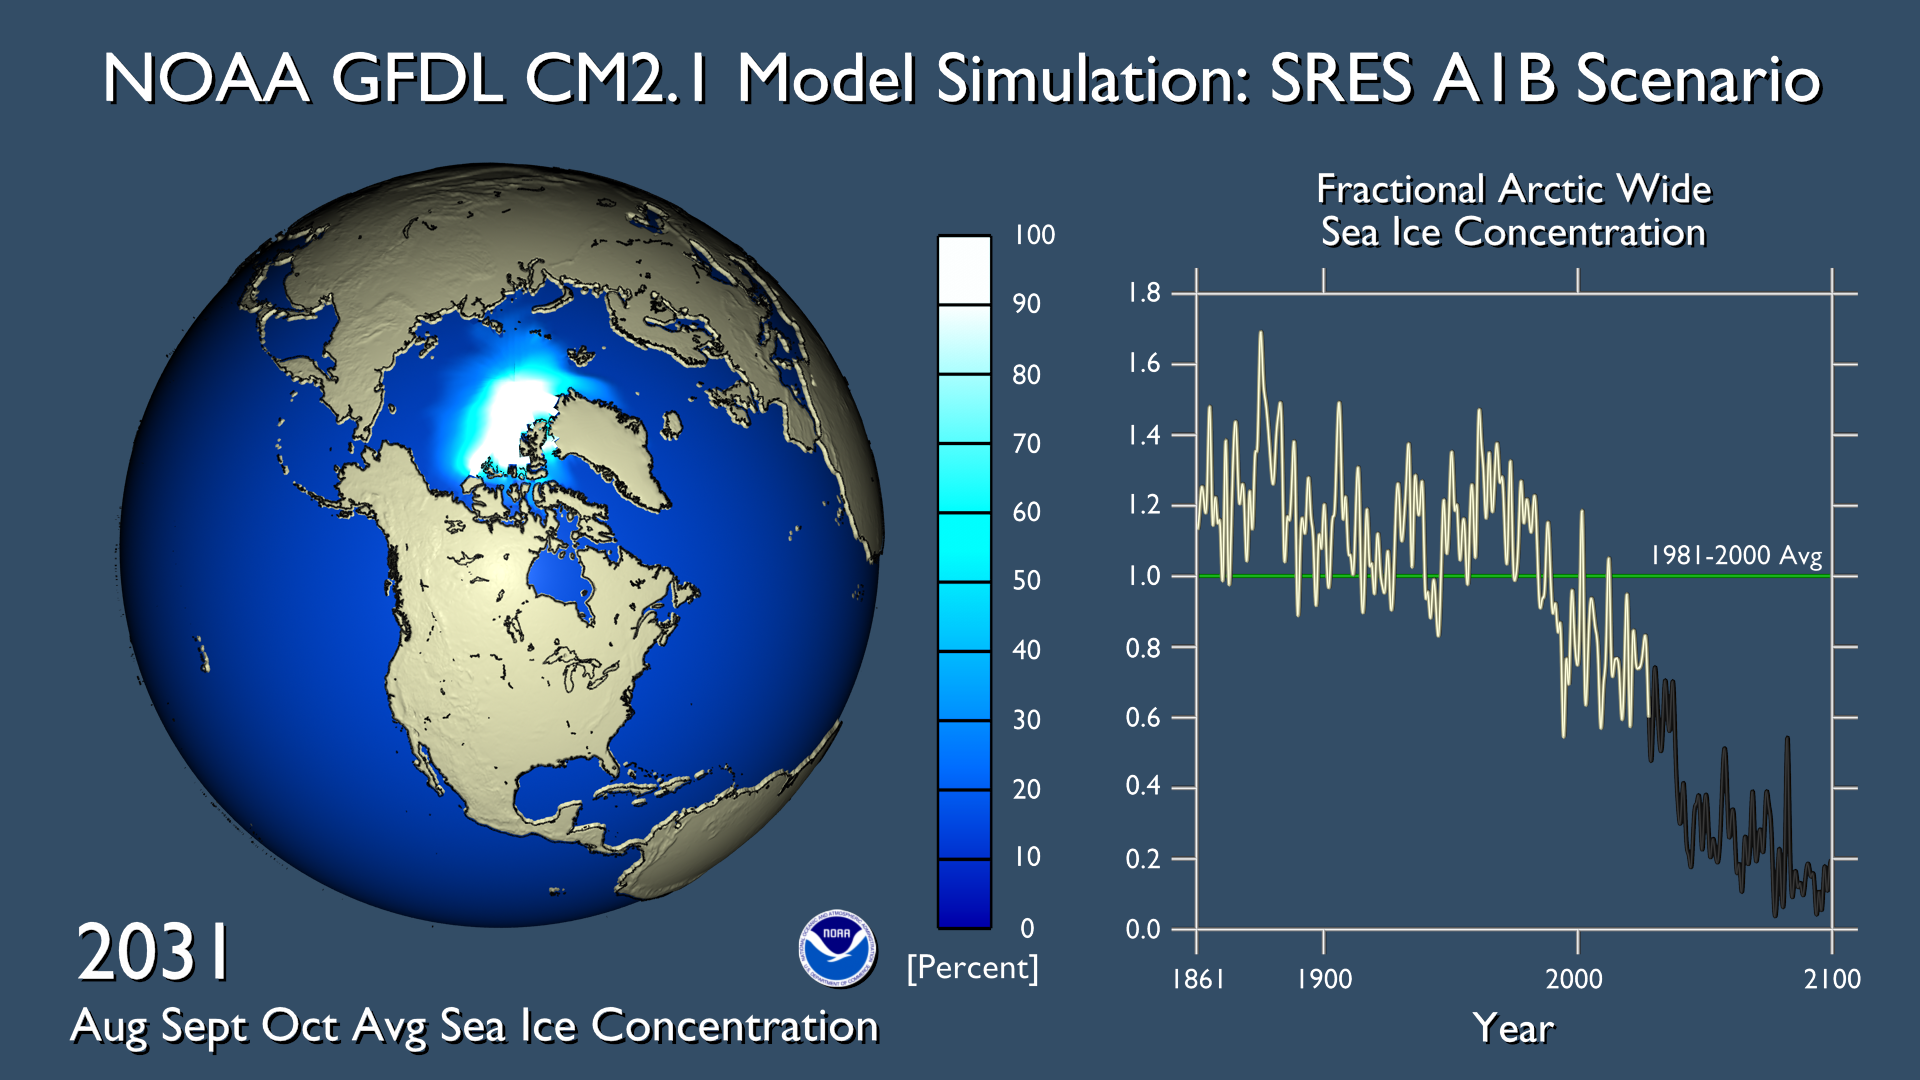
Arctic Sea Ice Changes | |
|
The future of Arctic sea-ice is a concern for various reasons
and simulations with GFDL's Coupled Model version 2.1
suggest a decline in sea-ice concentration, especially during the
21st century.
Animations: MPG (2.3 MB) | QuickTime (2.3 MB) |
El Niño Forecasting | |

|
Ocean temperature anomalies at the peak of an El Niño event,
simulated in a state-of-the-art climate model at GFDL/NOAA.
Worldwide losses resulting from the 1997-98 El Niño are estimated
at $32-$96 billion.
QuickTime Animation (5.5 Mb) |
| High Performance Computing | |
|---|---|
High Performance Computing and Research (NOAA Tech 2004) |
|
|
An overview of research and results at GFDL
presented from October 21-23, 2003 at NOAA Tech 2004.
Without animations (PDF - 2 MB). With animations (PDF - 54 MB | ZIP - 54 MB, Internal Only). |
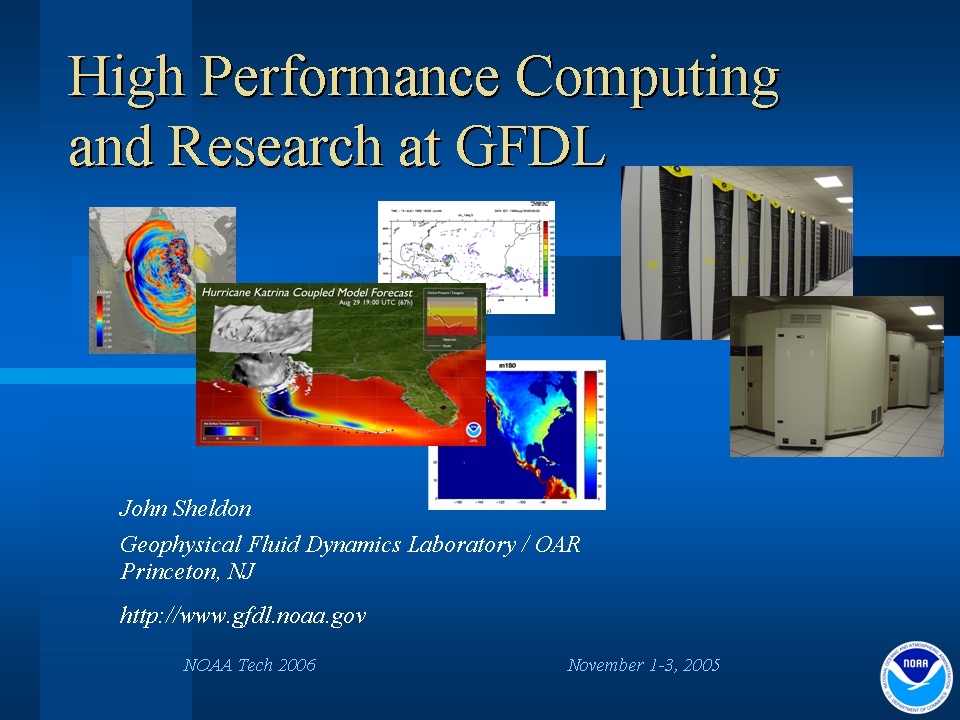
High Performance Computing and Research (NOAA Tech 2006) |
|
|
An overview of recent research and results at GFDL presented from November 1-3, 2005 at NOAA Tech 2006. |
| Hurricanes | |
|---|---|
Andrew (1992) | |

|
Costliest hurricane to ever strike the U.S. (Description) PNG Image |
Emily (1993) | |
|
Grazed the Outer Banks of North Carolina. (Description) Animations: MPEG (7.2 Mb), Quicktime(21 Mb) |
(Typhoon) Tim (1994) | |
|
Early forecast in the western Pacific (Taiwan). |
Gordon (1994) | |

|
Distorted by vertical wind shear, crossed Florida west-to-east. |
Opal (1995) | |

|
Category 5, but weakened before landfall in Florida. (Description) |
Erin (1995) | |
|
Crossed Florida, then made a second landfall. (Description) |
Fran (1996) | |
|
One of two storms to make landfall in the Carolinas this year. (Description) Animations: MPEG (4.4 Mb), Quicktime (12 Mb) |
Georges (1998) | |
|
Deadly storm which raked Puerto Rico, Hispaniola, Cuba , and the
Florida Keys, then traversed the Gulf of Mexico to hit the central
Gulf coast. See this
annotated handout
for an explanation on the visualization.
Animations: Panoramic View MPEG (7.4 Mb), AVI (25 Mb) Close-up View MPEG (7.7 Mb), AVI (42 Mb) |
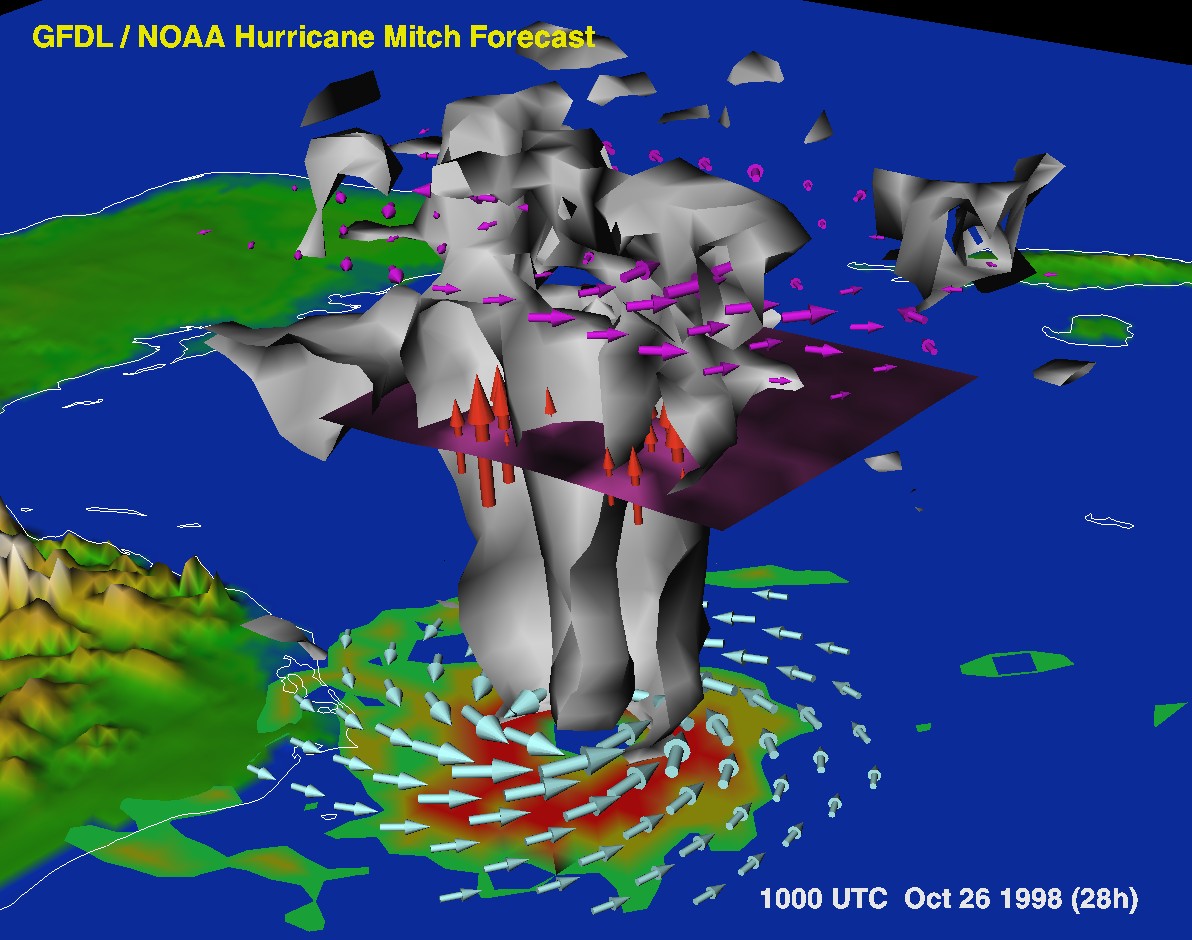
Mitch (1998) | |
|
Deadliest hurricane to hit Central America in 200 years. A category
5 storm at one point, Mitch stalled off the coast of Honduras, then
slowly moved through Central America, causing massive flooding.
Animations: MPEG (8.7 Mb), AVI (32 Mb) |
Floyd (1999) | |
|
One of the costliest hurricanes to ever strike the U.S. See this
annotated handout
for an explanation on the visualization.
TIFF Image (1.3 Mb) PNG Image Animations: 3D View MPEG (8.3 Mb), AVI (11.6 Mb) Instantaneous Precipitation MPEG (9.4 Mb), AVI (9.9 Mb) Accumulated Precipitation AVI (12.4 Mb) |
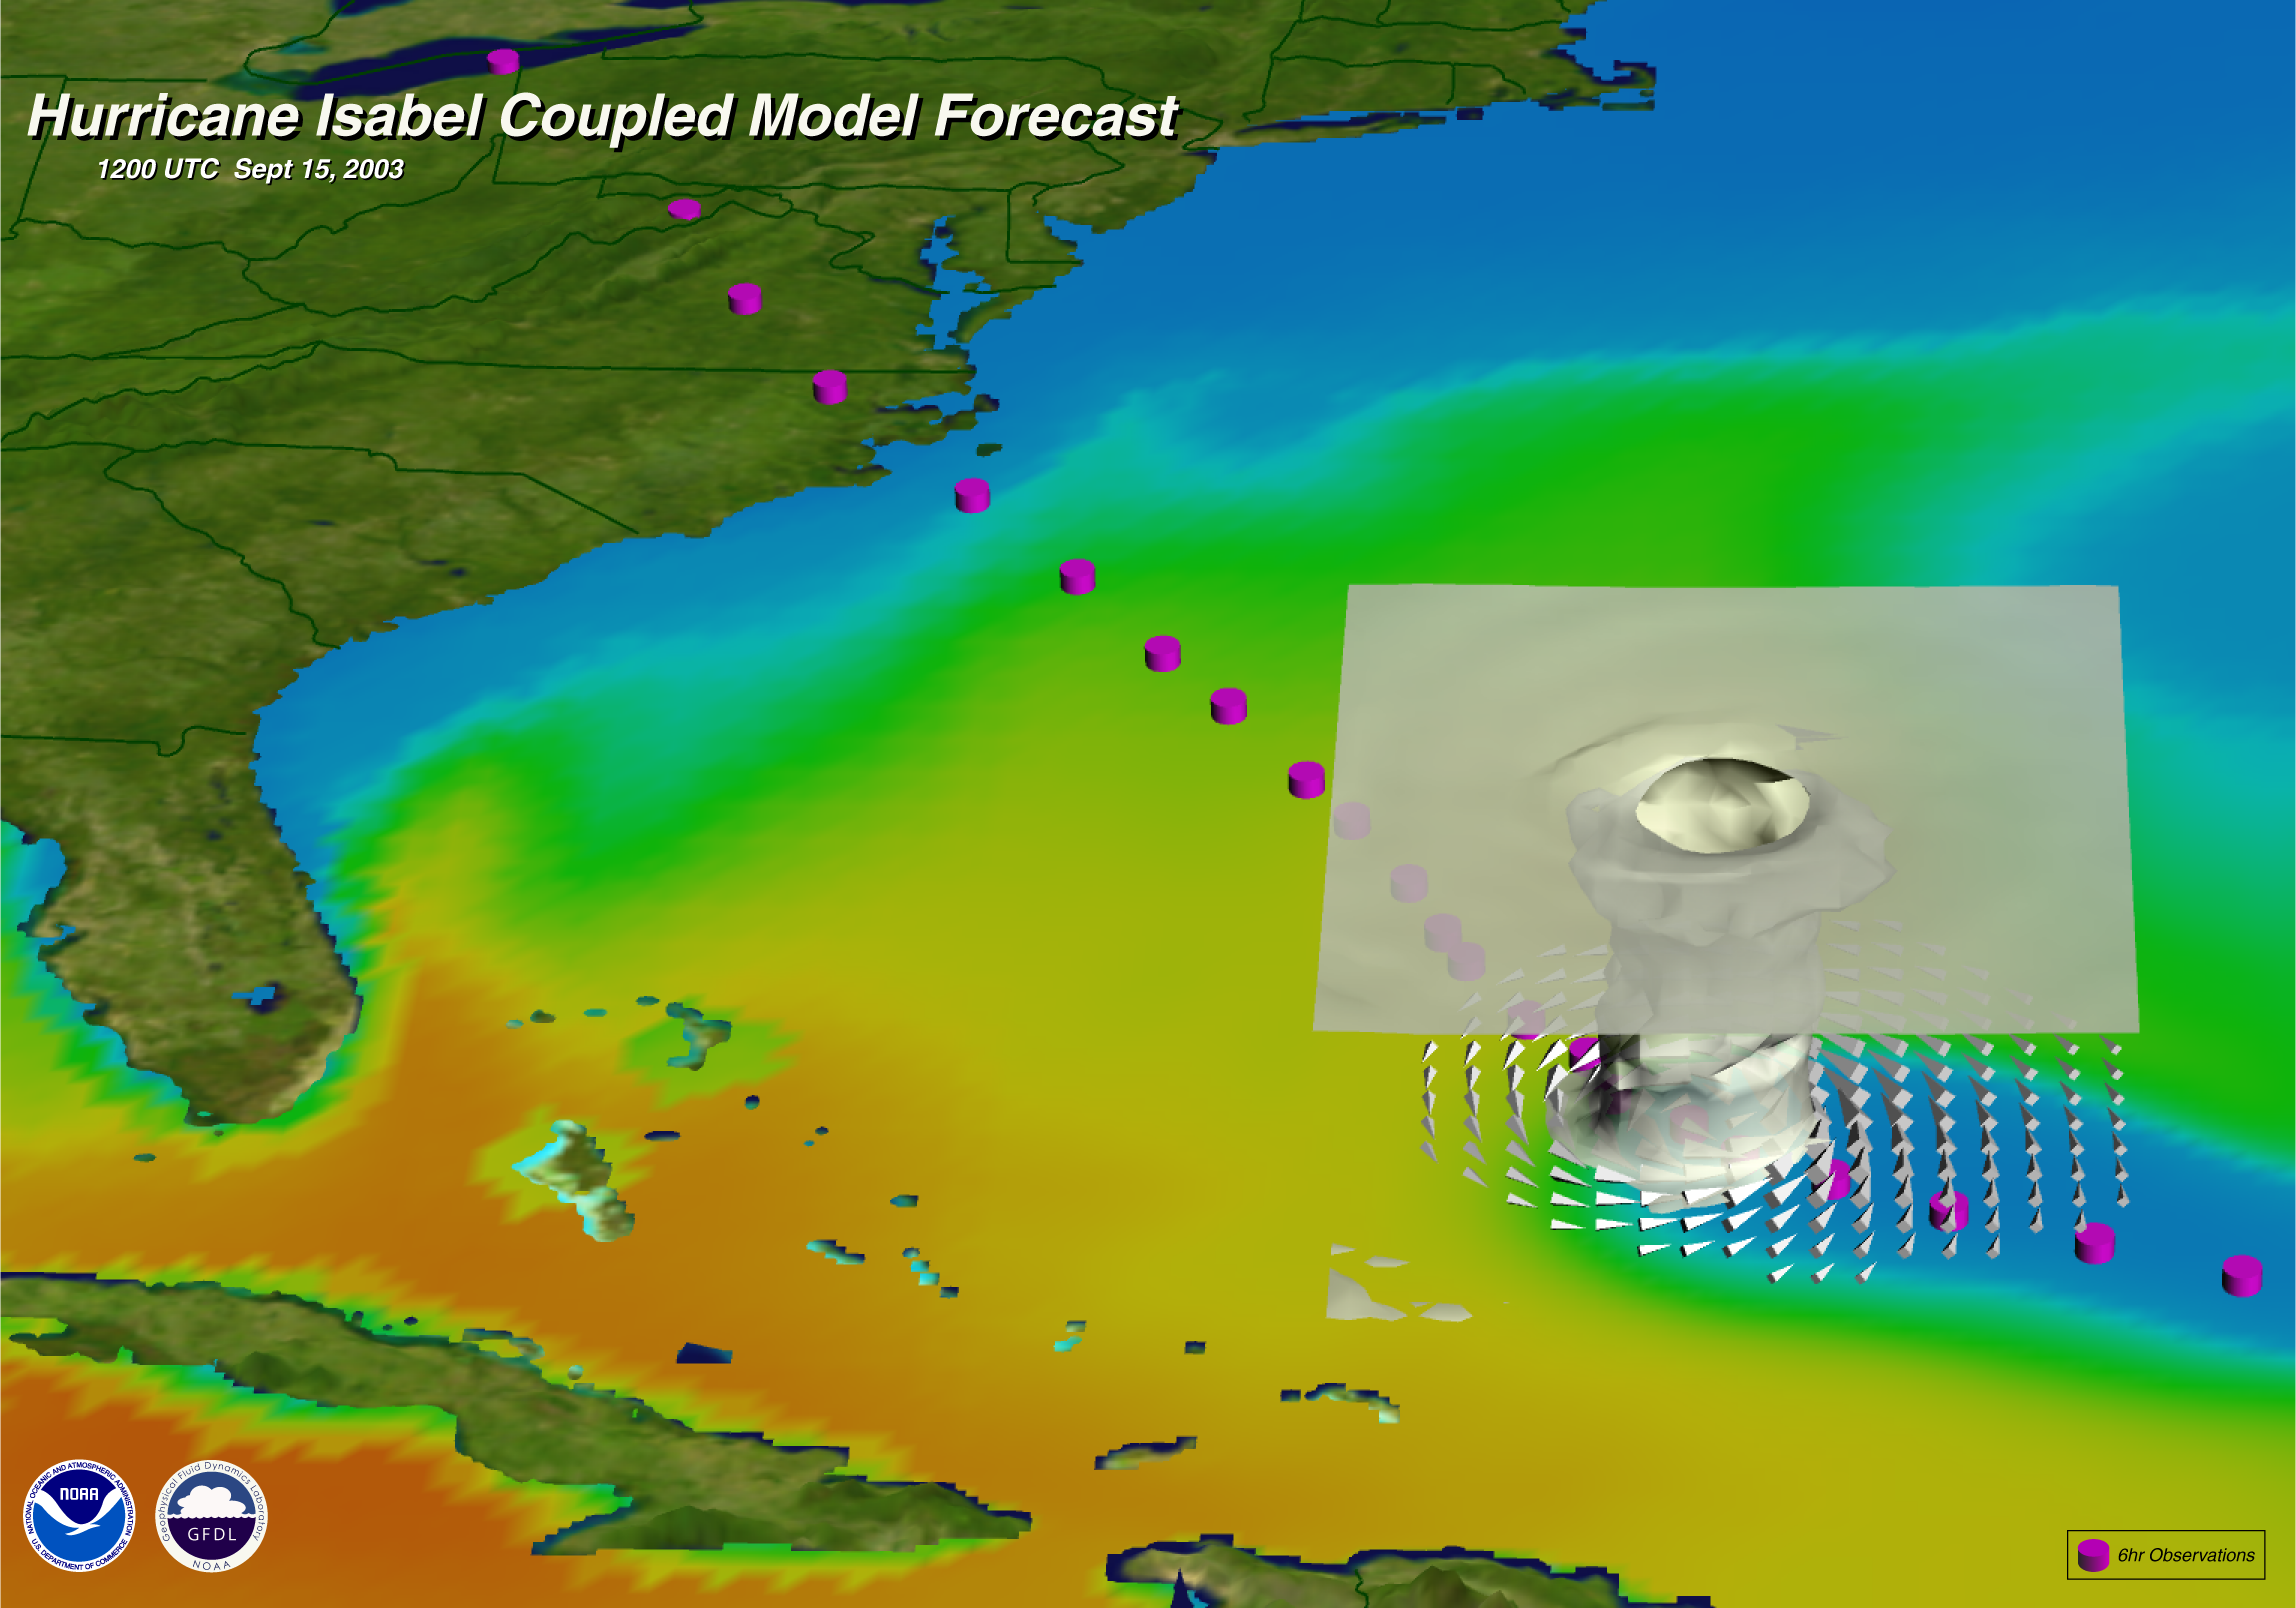
Isabel (2003) | |
|
Hurricane Isabel, which struck the Outer Banks of North Carolina on
September 19th, 2003, caused extensive damage over a large area of the
mid-Atlantic coast stretching from North Carolina to northern Virginia.
|
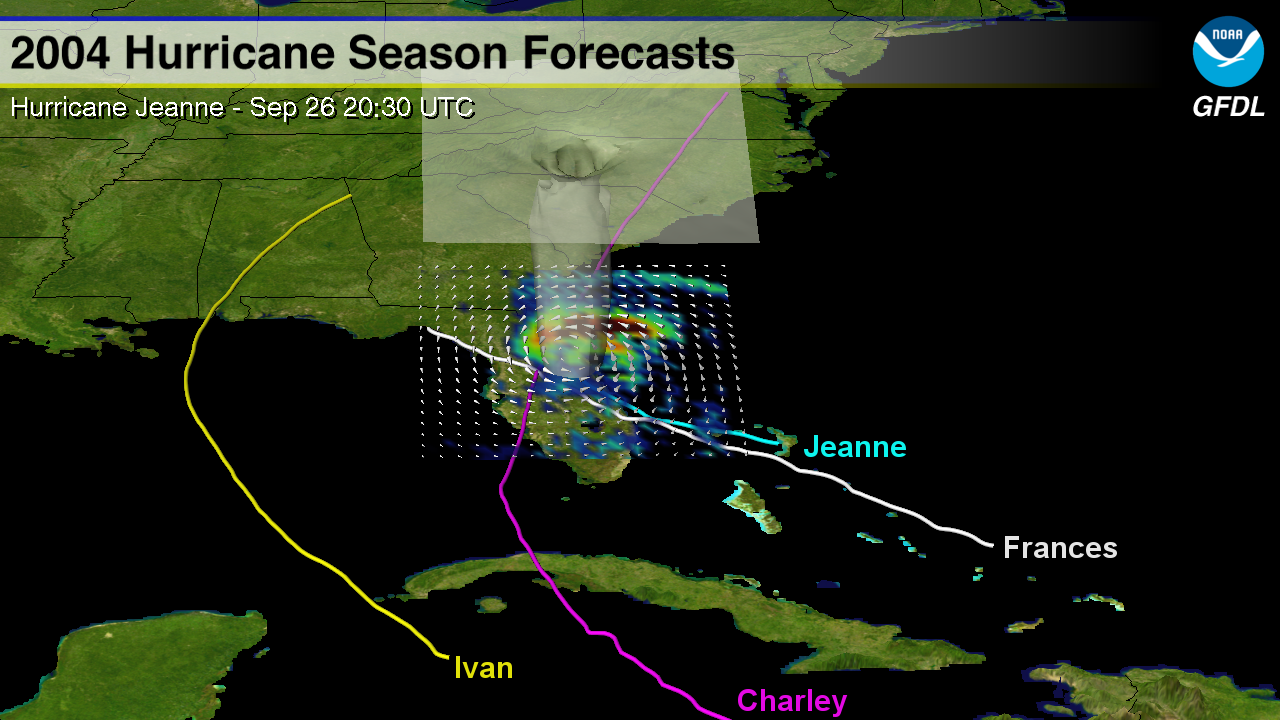
2004 Hurricane Season Model Forecasts | |
|
This sequence shows the model tracks, precipitation and eyewalls for the 2004 hurricanes Charley, Ivan, Frances, and Jeanne. Animation (MPEG4 - 27 MB) |
Katrina (2005) | |
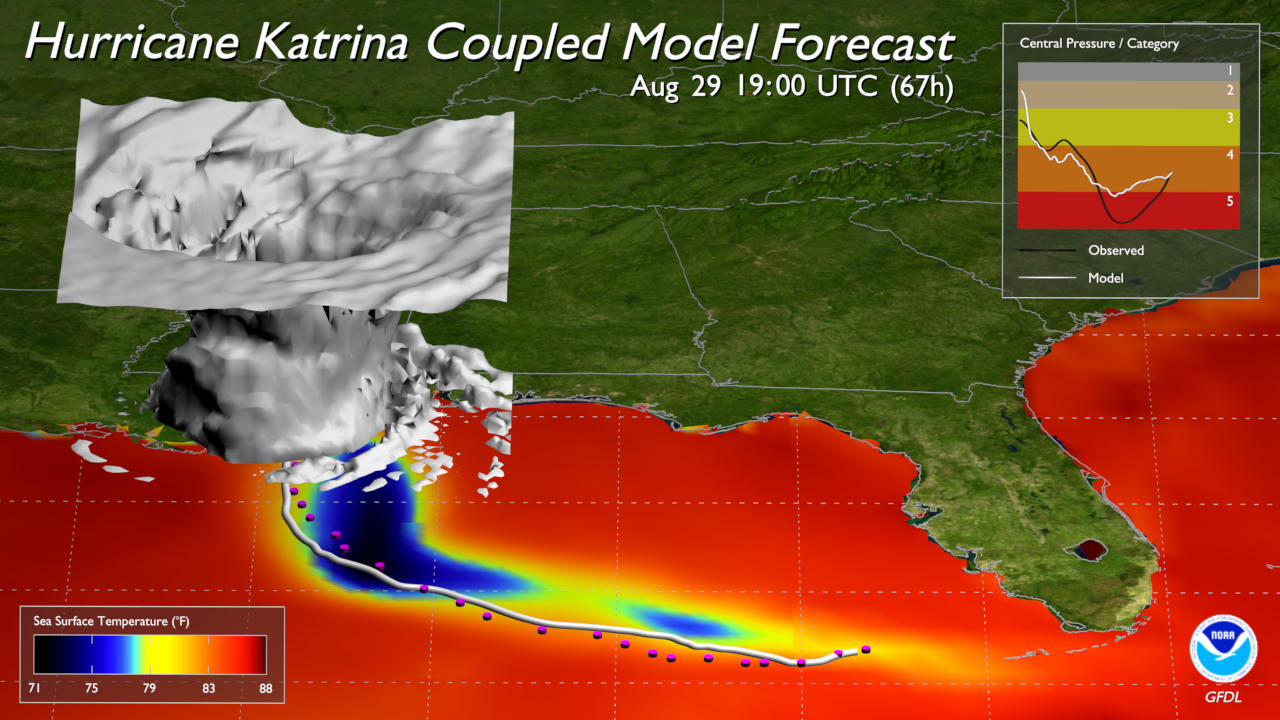
|
Hurricane Katrina's devastation and landfall along the Gulf Coast
on August 29, 2005 led to significant impacts on life, flooding,
travel, and the oil industry.
|
| Mesoscale Dynamics | |
|---|---|
The Blizzard of '93 | |
|
Advanced storm diagnostics developed at GFDL provide important insights into the evolution of intense storms, such as the so-called "Blizzard of '93", which roared up the east coast of the U.S. on 13-14 March 1993, setting new records in terms of snowfall, temperatures, and sea-level pressures. Some additional information is available from the mesoscale_dynamics group. |
Mesoscale Circulation Modeling | |

|
A stand alone explicit convection ZETAC model simulation (TERRA HRG_a) was done for the globe with an astonishing averaged grid resolution of about 10-12 km. Images and animations are available for this in addition to lower resolution experiments (TERRA HRG_00) and Pacific Storm Tracking. |
Cyclones and Storms | |

|
Developed at GFDL, ZETANC is a high resolution, non-hydrostatic, fully compressible model of hemispheric extent. The model is being used for the simulation of the detailed structure of extra-tropical storms and storm tracks. The studies are aimed in particular at a more definitive understanding of the effects of moist convection on storm structure and evolution. |
| Oceans | |
|---|---|
Ocean Surface Temperature | |

|
Sea surface temperature (SST) simulation from GFDL's high resolution coupled
atmosphere-ocean model. As the animation focuses on various locations
of the world ocean we see the major current systems eg. the Agulhas
current, Brazil current, Gulf Stream, Pacific Equatorial current,
Kuroshio current. The small scale eddy structure is resolved and evident.
Animation: QuickTime (116 MB) | MPG (61 MB) Indian Ocean Animation: QuickTime (67 MB) | WMV (72 MB) |
Ocean Surface Salinity | |

|
This is a simulation of the Arctic Ocean Surface Salinity from GFDL's
high resolution coupled model. One can see the seasonal cycle of
summertime freshening from sea ice melt as well as the salty water
entering from the North Atlantic current.
Animation: QuickTime (44 MB) | MPG (30 MB) Indian Ocean Animation: QuickTime (45 MB) | WMV (56 MB) |
Ocean Surface Speed | |
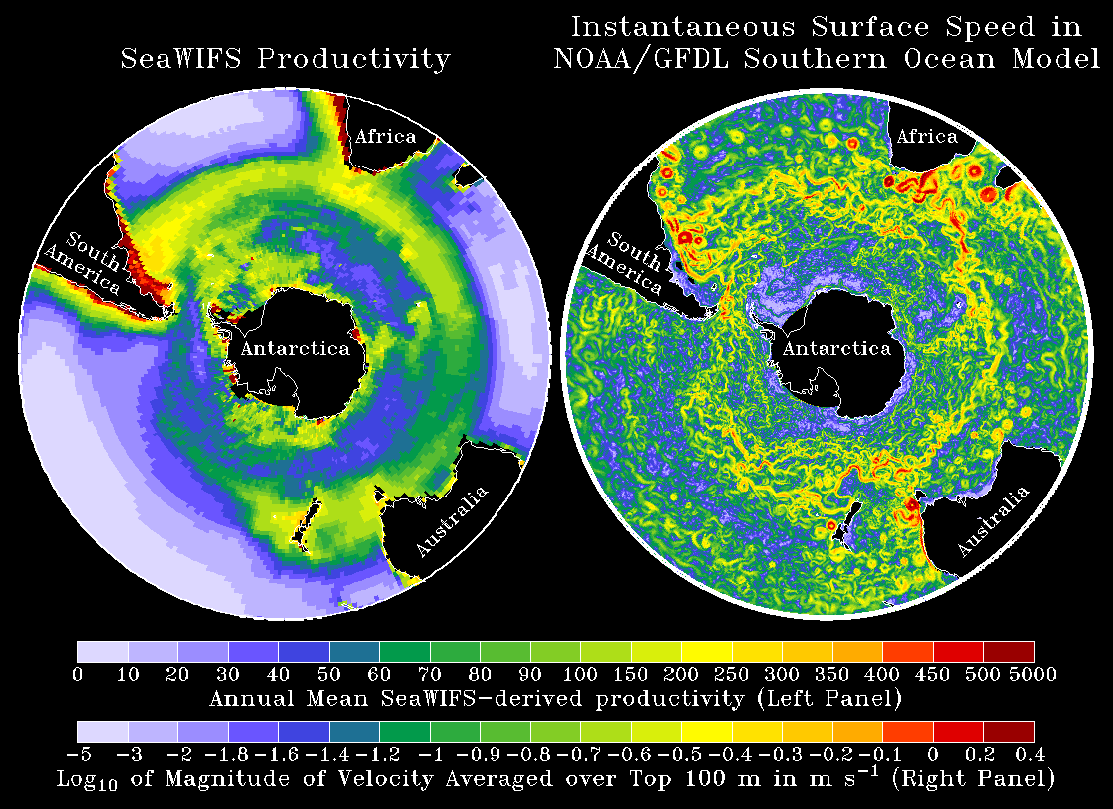
|
A three-dimensional ocean circulation model has been used for studying both the ocean climate system and more idealized ocean circulations. |
Surface Height (Eddies) | |
|
Eddies have a profound effect on ocean mixing processes.
Models here at GFDL have improved model resolution to resolve
smaller eddies, which previous models could not do.
AVI Animation (29 Mb) |