If you are using
Navigator 4.x
or
Internet Explorer 4.x
or
Omni Web 4.x
, this site will not render
correctly!
Vis > gallery > climate prediction > Water Flow Visualization
Water Flow Visualization
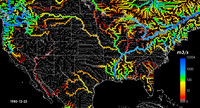
This animation depicts the flow of water through the river system of the United States. Color and width of line indicates volume of flow passing a given point per unit time. The data were obtained from a two-year simulation of land water and energy balances, coupled to a network model of the river system. Because the model was started from a dry initial state, little flow is produced in the first year. Note the production of flow by spring snowmelt in the Rockies and the subsequent downstream flows.
| Water Flow | |
| MPEG4 Animation (20 MB) |
| Model | |
| Model Name: | Land Model (LM2) |
| Domain | |
| Resolution: | 180x120 |
| Project | |
| Scientist: | Chris Milly (USGS) |
| Date Created: | April 2005 |
| Visualization | |
| Personnel: | Remik Ziemlinski |
| Software: | MEncoder (Animation) VTK (Geometry and Rendering) Python (Scripting) NetCDF (Data Formatting) |

