Relating Air Temperature to Surface Temperature

January 6th, 2009

As Dr. C wrote during his Surface Temperature Field Campaign, the weather in mid-December was cold in many parts of the United States. At our house here in Boulder, Colorado (Figure 1), this morning’s minimum temperature was -21 degrees Celsius. Just 20 kilometers east of here, the minimum temperatures was 27 degrees Celsius below zero, and about 50 km to the southeast of here, the minimum temperature reached -28 degrees Celsius. The weather reports were saying that those of us who live closer to the mountains weren’t having temperatures as cold as those to the east of us.

colorado.jpg

Figure 1. Map showing location of Boulder and CASES-99. The colors represent contours. The Rocky Mountains are yellow, orange, and red on this map. The colors denote elevation, with yellows, oranges and reds indicating higher terrain.

How does the air temperature relate to the surface temperatures that the students measured during Dr. C.’s field campaign? To answer this question, I looked at how the surface temperature related to the air temperature at our house.

The air temperature at our house was measured at 1-1.5 meters in our carport, and also on a thermometer I carried with me on our early-morning walk around the top of our mesa. That temperature, as noted above, was -21 degrees Celsius. To get the surface temperature, I put the thermometer I was carrying on the surface after I finished my walk. I am assuming that this temperature is close to the temperature that would be measured by a radiometer like the one used in GLOBE. I took the reading ten minutes later.

Just for fun, I also measured the temperature at the bottom of our snow (now 10 cm deep) and at the top of the last snow (about in the middle of the snow layer). At these two places, I put the snow back on top of the thermometer, waited ten minutes, and then uncovered the thermometer and read the temperature. The new snow was soft and fluffy, while the old snow was crusty; so it was easy to find the top of the old snow.

All of the measurements were taken close to sunrise, when the minimum temperature is normally reached, and the area where I took the measurements was in the shade.

Figure 2 shows the temperatures that I measured.

fig-2_snow_temp_boulder.jpg

Figure 2. Temperature measurements at the snow surface, between the old and new snow, at the base of the snow layer, and at 1-1.5 meters above the surface at 7:30 in the morning, local time.

That is, the temperature was coolest right at the top of the snow. The temperature was warmer at the top of the old snow, and warmest at the base of the snow. As noted in earlier blogs, the snow keeps the ground warm.

The temperature at the top of the snow was also cooler than the air temperature. The surface temperature is often cooler than the air temperature in the morning, especially on cold, clear, snowy mornings like this one. However, on hot, clear, days in the summertime, the ground is warmer than the air.

Here are two sets of measurements taken in the Midwestern United States in October of 1999. Could you guess which measurements were taken at night, and which measurements were taken during the day even if the times weren’t on the labels? The first plot is from data taken after sunset, while the second plot was from data taken at noon.

t9oct_2000lst.jpg

t11oct_1200lst.jpg

Figure 3. Data from the 1999 Cooperative Atmosphere Exchange Study (CASES-99) program in the central United States, courtesy of J. Sun, NCAR.

Chinook!

December 30th, 2008


On 7 December, when I wrote the blog below, we were experiencing a warm wind called a “Chinook” here in Boulder, Colorado. I wanted to wait until after the surface temperature field campaign to post this. It seems appropriate to do so this morning (30 December), since we are again experiencing a Chinook, and this blog was designed to follow the second birding blog. Winds have gusted to over 100 kilometers per hour, and the temperature outside is 12 degrees Celsius – quite warm for an early morning in December! During a Chinook, the temperature warms rapidly. Chinooks are also called “snow eaters” because they can make winter snows disappear quickly. They can also make the temperature rise suddenly by tens of degrees.

In my last blog on birding, I took a picture of a blind on Saturday, 6 December (Figure 1). Early that morning, the temperature was cold (about -5 degrees Celsius) and the ground had about 12 centimeters of snow on the ground. The lakes near the blind were frozen when we arrived there around 9:30 a.m. local time. The temperature was probably still below freezing when I took the picture. The next morning, we woke up to 10 degree Celsius temperatures, and the 12 centimeters of snow we had in our yard had entirely disappeared. When we returned to the blind to record the how different things looked, it was 11:30 a.m. local time – about 26 hours later.

figure-_1_icy_blind.JPG

Figure 1. Picture of blind taken for last blog. Sawhill Ponds, Boulder, Colorado, 10:00 a.m. Local time. The snow was about 10 centimeters deep here; the lakes were frozen.

figure_2_warm_blind.JPG

Figure 2. Picture of blind, roughly 26 hours later (11:30 Local Time, 7 December 2008). Note that not only has the snow disappeared, but the soil is dry in some places.

Basically the temperature didn’t fall much the night of 6 December – in fact it might have even warmed. This is because air is coming down from higher up in a Chinook. As air sinks in the atmosphere, it gets compressed (squashed) by having more air above it pressing down. This squashing warms the temperature – much as the temperature of the air in your bicycle tire warms when you pump (squeeze) more air into it. In sinking dry air, the temperature rises 10 degrees Celsius for each kilometer – quite a bit.

Figure 3 shows the temperature record for another Chinook (the instruments at NCAR Foothills Lab, which lies between where we live and Sawhill Ponds) weren’t working on 6-7 December, so I couldn’t get the data). The air is very dry during the Chinook. (The air is dry if the temperature is much higher than the dew point. Recall that fog or dew forms when the temperature and dew point are equal, so it makes sense that drier air has lower dew points). The dryness of the air is not surprising – the air is drier higher up. So the dryness is a sign that the air is coming from higher up.

figure_3_ttd10feb08.png

Figure 3. Temperature and dew point from a Chinook on 11 February 2008, at roof level. From NCAR Foothills Laboratory in Boulder, Colorado. You can tell from the cooler temperatures starting around 15:00 local time that the Chinook ended about that time. From http://www.rap.ucar.edu/weather/.

You notice how the temperature went up half way between 23:40 (11:40 p.m.) and 02:40 (2:40 a.m.) local time and then didn’t change much for the rest of the night like it normally does? Also the temperature wasn’t going up much the next morning. (Note: 50 degrees Fahrenheit is about 10 degrees Celsius). During this time the wind was out of the west – from the mountains, meaning sinking air (Figure 4). Also notice that the temperature cools off when the wind changes from west to north at around 15:00 local time (3:00 p.m.).

figure_4_dd10feb08.png

Figure 4. As in Figure 3, but for wind direction

The lack of a temperature change makes me think that the air in Boulder didn’t just simply slide down the mountain, but we were getting air from above the surface. Air high above the ground doesn’t cool or warm as much as air right next to the ground does.

So we have four clues that the air came from higher up during the Chinook. First, the temperature rose to abnormally high levels at the onset of the Chinook and rapidly cooled afterward. Second, the wind came from the mountains to the west. Third, the air was very dry. And finally, the temperature didn’t change during the day like it normally does. The last clue also suggests the air came from above the surface.

What do the clouds look like? In a Chinook, the wind blowing across the mountains flows in ripples much like the water flows over rocks in a stream. It’s harder to see air flow than to see the water flow. However, clouds occur when the air is at the top of ripples, if the air is moist enough. From the surface here in Boulder, we saw a long line of low clouds stretching along the mountains (one ripple), and higher cloud doing the same thing, but farther east (Figure 5).

figure_5_chinook_clouds.JPG

Figure 5. Clouds associated with the Chinook at 14:50 local time, looking northwest. The mountains are to the west. The cumulus clouds near the horizon are just to the east of the mountains, which are not visible on this picture. The higher clouds (altocumulus) are part of a broad north-south band starting east of the mountains. The little tail in the middle is the leftovers from a contrail. Looking eastward, I could see that the altocumulus clouds stretched to the horizon.

You can probably see this more clearly from space. First, I show you the visible image (Figure 6). You can see some ripples over the mountains, a dark area stretching from Boulder (plus sign) to the south, and the altocumulus (or higher) clouds extending east-south east from the dark area.

figure_6_vis.JPG

Figure 6. GOES satellite visible image of clouds at 2132 UTC (1432 Local Standard Time). The plus sign snows where Boulder is. Note the north-south clouds along the Rockies in the middle of Colorado (like ripples in the water). Then there is a broad band of clouds stretching eastward to the east side of Colorado. This is the larger-scale view of the altocumulus in Figure 5. From http://www.rap.ucar.edu/weather/satellite/.

We can see the difference in the heights of the “ripples” and the broad area of altocumulus clouds by looking at the image showing the infrared signal (Figure 7), which is related to the temperature the satellite “sees” – either at the surface or at the top of the clouds. Since the temperature in the atmosphere drops with height at these heights, this temperature can be used to estimate cloud top height. The brighter areas indicate higher cloud tops, so the broad band of clouds to the east of Boulder appear to be higher than the ripples, which are hard to see.

figure_7_ir.jpg

Figure 7. GOES satellite infrared image in and around Colorado at 2132 UTC (1432 local time). The plus sign shows where Boulder is. The broad bands of clouds are showing up much more than the ripples. Since lighter colors indicate higher clouds, this tells us that the broad area of clouds to the east is higher than the ripples – just as in the picture I took in Boulder. (But I’m not sure we can see the ripple in my picture on the satellite). From http://www.rap.ucar.edu/weather/satellite/.

What was the result of the Chinook? We already pointed out the much warmer temperatures, the complete melting of our snow (12 cm in our yard originally), and the melting of ice on many of the lakes.

This also affected the ducks in the lakes near the blind.

On 6 December, when we went out to photograph the blind, we could find no ducks on the frozen ponds – only Canada geese waddling on the ice. Also, there were almost no birds at the feeders in our back yard. We were surprised, because we thought they would be hungry in the cold weather.

On 7 December, when we got up, the feeders were full of birds. So were the trees: chickadees, pine siskins, sparrows, finches, juncos, and collared doves, were eating continuously, even when squirrels and cats (and in one case a deer with antlers) came by. Today, when we went back to Walden Ponds (north of the blind), we saw many ducks on the one pond that had thawed out most completely. And the ducks and geese were eating. My guess is that they were making up for yesterday. But – there is a mystery. Where were the ducks during the cold weather? What do you think?

Do you have names for winds where you live? Winds – particularly those that bring different weather – have names around the world. In Africa, the hot dry winds that come south from the Sahara are called Harmattans. In southern Europe, cold winds that come out of the mountains are called Boras and warm winds that come out of the mountains are called Foehns in Germany. However, we also use the word “foehn” to describe warm dry winds from the mountains in the United States. In South Africa, the warm winds coming from the mountains are called “berg winds,” since “berg” means mountain in Afrikaans. There is no snow to melt, but the berg winds do raise the temperature in winter.

Observing Birds – Part 2

December 23rd, 2008


After the first of the year, when school is starting again in the U.S., I will write something about surface temperature measurements. Now, since many are out of school and have time to spend outside, it seemed like good timing to post a second blog about birds.

In my last blog, I mentioned observing birds from a blind. What is a blind? It’s a structure that keeps the birds from seeing you. Usually, it’s made up of three walls and a roof, like the one I visit frequently here in Boulder (Figure 1). Blinds are built near places where you would expect birds. For example, there are often blinds near lakes, so that you can watch ducks. One nice thing about observing bird this way is that you can see them really well (you have to be very quiet, so you don’t scare the birds away), and you can photograph them. With the new electronic cameras, it doesn’t take much money to get and print nice pictures of birds.

figure1a_blind.JPG

Figure 1a. Blind at Sawhill Ponds, Boulder.

figure1b_blind.JPG

Figure 1b. View through one of the windows inside the blind.

Last week, we were birding at Palo Duro Canyon (marked by the + sign), which lies southeast of Amarillo, Texas (See Map in Figure 2).

figure_2_palo_duro.JPG

Figure 2. Map showing Palo Duro Canyon, in the Texas Panhandle.

When we paid for going into the park, we were told that there was a blind near the Trading Post, where we could watch the birds. Of course there were many trails to walk on as well, but the blind was special, because we could watch the birds without disturbing them.

Here, the blind was near two bird feeders and an artificial stream where the birds could bathe. There was also a lot of nearby brush so that the birds had a place to escape to if they were frightened. For the humans, there are often benches to sit on inside the blind.

Here are some birds that we saw from the blind.

figure_3_fox_sparrow.JPG

Figure 3. Fox Sparrow. This bird is about 18 cm long.

figure_4_cardinal.JPG

Figure 4. Northern Cardinal (22 cm long)

figure_5_goldfinch.JPG

Figure 5. Goldfinch (13 cm long)

figure_6_pine_siskin.JPG

Figure 6. Pine Siskin (13 cm long) busily feeding.

figure_7_white_crowned_sparrow.JPG

Figure 7. White crowned sparrows

These pictures were taken with an ordinary digital camera with a zoom lens. Notice the brush in the background. You can take pictures, too – but avoid using your flash bulb. That will startle the birds. If it is too dark to get pictures without a flash bulb, just enjoy the birds and come back another day to take pictures.

It was fun to watch the birds interact with one another or with other animals. The Cardinal would chase the Goldfinches and Pine Siskins away. They would wait in the bushes until the Cardinal flew away, and then come back in and eat some more. This morning there were several Sparrows (I think) at our feeder here in Boulder this morning. They would take turns eating thistle seed – until a squirrel frightened them away.

Of course we saw birds while hiking at Palo Duro Canyon, but it’s hard to get close enough to photograph them without scaring them away – and we didn’t want to do that. But there was one kind of bird big enough to photograph from a distance – the Wild Turkey (Figure 8). Figure 8 is a bit blurrier than the others because it was taken in dim light and I didn’t have a tripod.

figure_8_wildturkeys.jpg

Figure 8. Wild Turkeys (Males are 46 cm long; females 37 cm.)

How do I know what birds these are? Some I learned a long time ago. But when I see a new bird, I look at a field guide with pictures of birds. Or I take notes on what the bird looks like and the way the bird behaves. Is it wagging its tail? Does it fly around a lot? Does it feed on the ground? Does it like to be high up in the trees? How big is it (it helps to have other birds you know nearby for scale, but this doesn’t always happen). Does it eat berries? What is the shape of its bill? Then, when I get home, I can either look at a bird book or find information about the birds on the Web. For a really nice introduction to identifying birds, a very helpful site is All About Birds, and of course there is some really nice information on hummingbirds at the Operation Rubythroat website.

You can have a “blind” at home. Look for a place for a bird feeder outside a window. If there are trees or bushes nearby, the birds have a place to go if they get startled. Look on the web (including the web site sited last time) for how you can make your yard comfortable for birds.

Once you know a few common birds for your area, you can watch for their arrival in the spring or fall. Common birds are probably easiest to use to indicate seasons, since your chances of seeing them are better. In the meantime, enjoy the winter birds!

Dr. C.’s GLOBE Surface Temperature blog 12-16-08

December 16th, 2008

By taking your measurements for Dr. C., you are participating in science. Lots of scientists take measurements of different kinds to test new ideas, or to figure out how to measure things in new ways, like, for example, using a satellite instead of taking measurements everywhere on the ground. (You need to compare the new measurement with an old one that you trust.). Scientists analyze the data, and then they present the results at conferences like the one described below, and write articles about the results in scientific journals. When scientists write articles, the journals send the papers to other scientists for their opinions and suggestions before the article is ever published. These comments, and the comments from colleagues at conferences like this one for American Geophysical Union, helps scientists refine their ideas and present them more clearly to others. Also important are chance (or arranged) meetings with other scientists in the halls, next to a poster, or over coffee. Lots of fun and important ideas are exchanged at such conferences, and scientists can come away with totally new ideas about what to do next. — PL

Today I am blogging from San Francisco, California. I am attending the American Geophysical Union (AGU) meeting in San Francisco, California. It is a meeting that I try to come to every year. AGU is a professional organization made up of scientists who study the Earth and our solar system.

A conference like this one is a way for scientists to share information. The picture below shows how the scientists show each other the research they have performed. You might be thinking, “Dr. C, that looks a lot like a science fair that my school has.” You would be right. Poster presentations are very similar to science fair projects that students do.

figure_1_agu.jpg

Figure 1. Poster session at the AGU meeting.

Coming to the AGU meeting gives me a chance to see my scientist friends. My friend Claudia Alexander is the lead scientist on the Casini-Huygen project and Rosetta mission for NASA. The Casini-Huygen project is a satellite that is studying Saturn and its moon Titan. The Rosetta mission is going to study what makes up comets.

I presented a poster on an Earth System Science education course that I teach. Teachers take the course to continue their learning. You may have not known that either. Below is a picture of Gary Popiolkowski. He is a seventh and eighth grade science teacher at Chartiers-Houston Jr./Sr. High School in Houston, Pennsylvania. His students made the poster for him. It is a great poster as you can see from the picture. He mentioned to me how proud he was of his students for designing and making the poster.

figure_2_100_0678.jpg

Figure 2. Teacher Gary Popiolkowski

figure_3100_0679.jpg

Figure 3. It’s me, Dr. C in front of my poster at AGU.

Dr. C

Czajkowski’s GLOBE Surface Temperature blog 12-15-08

December 15th, 2008

This is the start of the last week of the surface temperature field campaign.

Wow, the weather around the Northern Hemisphere sure has been active. It looks like in the United States we are going to have a good old-fashioned winter with cold temperatures and stormy conditions.

Can you tell that I like winter?

I started to take an interest in weather when I was 10 years old growing up in a suburb of Buffalo, NY. Buffalo is at the eastern end of Lake Erie. The area receives significant snowfall each year called lake-effect snow. This is caused by cold air from Canada passing over the warm water in fall and winter. The air collects water vapor from Lake Erie as it crosses the lake and deposits in on the downwind side. In 1977, there was an incredible blizzard in Buffalo called the Blizzard of ‘77. School was cancelled for 5 days straight. I thought it was the best thing going. Funny, though, that my love of missing school has turned into a love for winter weather and led to my career as a professor.

Here is a recap of what has happened over the last week. There has been flooding in Hawaii as well as in Italy.

figure-1_buffalo_loc.gif

Figure 1. Location of Buffalo (New York) and Toledo (Ohio) on map of the United States.

New England Ice Storm
New England received a terrible ice storm. The storm slowly moved up the east coast of the United States and produced up to an inch of ice on tree limbs and power lines. Many trees were damaged and power lines were brought down, knocking out electricity to over a million people.
Rare snow in Texas and Louisiana
The same system that caused the ice storm produced measurable snow as far south as Houston, Texas and Lake Charles, Louisiana. See the snow cover map below to see where the snowfall occurred. Kids had a lot of fun making snowmen and throwing snow balls.

figure_2.jpg

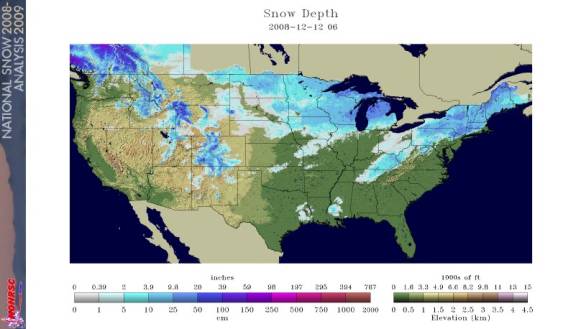
Figure 2. Snow depth map for 12 December 2008.

Blizzard in Montana, North Dakota, South Dakota and Minnesota
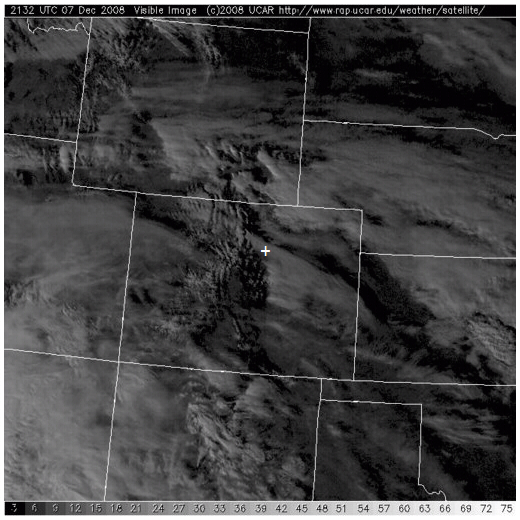
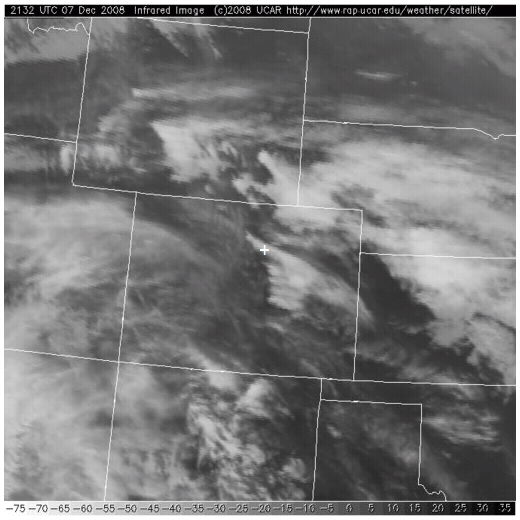
The weather pattern has changed dramatically. When the ice storm occurred, there was cold air and storminess in the eastern United States. The western United States was warm and calm. That has now changed. A significant winter storm has moved into the western United States. This has given much needed snow and rain to Washington, Oregon and California. This system has been accompanied by extreme cold temperatures in the Canadian plains and northern United States. High temperatures were in the –15º C range. That’s cold by anybody’s standard. The strong high pressure system in Canada that brought the cold air along with the storm system (low pressure system) produced very strong winds in Montana, North Dakota and South Dakota. This produced dangerous conditions, white-out snow conditions, drifting snow and dangerous wind chills. I have experienced four real blizzards in my lifetime. To be a blizzard, the wind speed has to be greater than 35 mph (16 m/s), visibility has to be below a ¼ mile (0.4 km), and temperatures have to be cold for three hours straight. The blizzard of ’77 in Buffalo was by far the worst blizzard I was ever in. Blizzard conditions lasted for three days straight.

Cold temperatures in Toledo, Ohio produced early ice
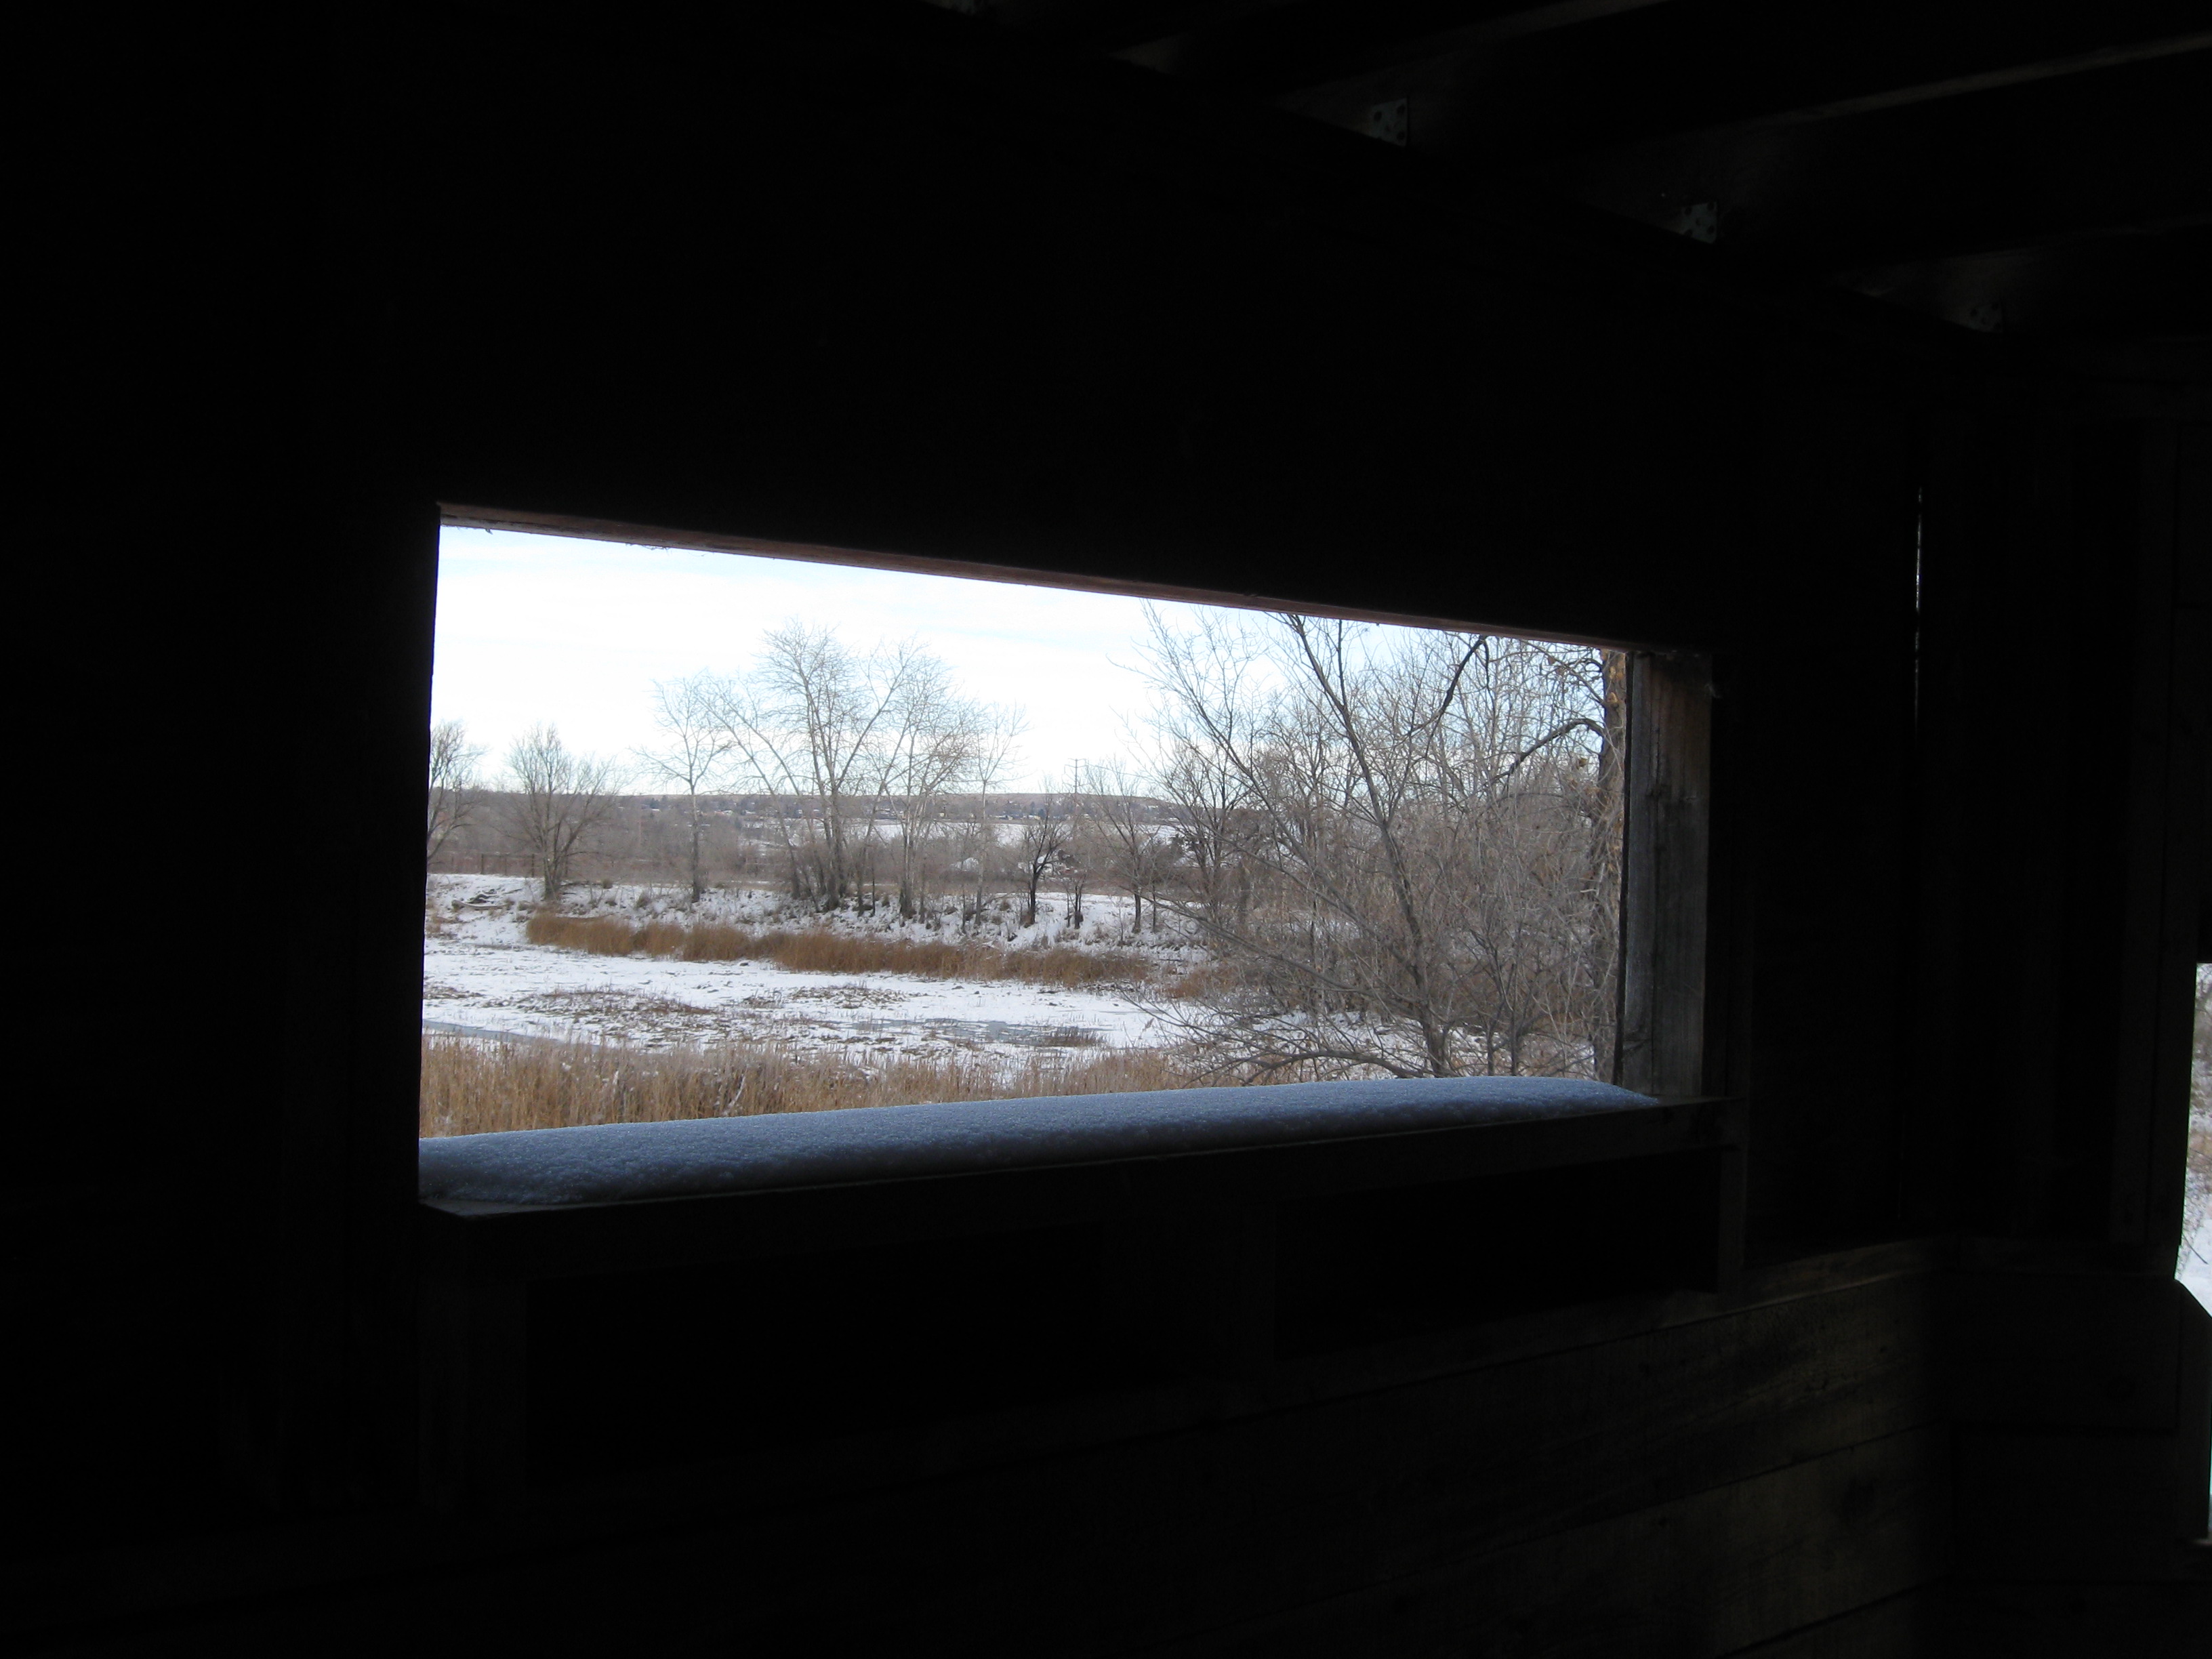
Where I live near Toledo, Ohio, most of November and thus far in December have been colder than the long-term average. In fact, so far in December, temperatures have averaged 4º C (7º F) below the long-term average. Ice has formed on ponds, lakes and rivers. My students and I are studying the Ottawa River that flows through the University of Toledo campus. We are doing this as part of GLOBE’s Seasons and Biomes Project. We are studying the way in which the river freezes and thaws. The observations were taken from a foot bridge and an attempt was made to keep the same part of the river in the frame. You can see in the images below that the river was ice free on 3 December 2008. By 8 December 2008, ice extended out from the banks of the Ottawa River about 4/10 of the way out on both sides of the river. There was a small area of open water down the middle of the river. Lastly, the ice started to melt on 9 December 2008 and then was completely gone by 10 December 2008 when there was quite a bit of rain. This week-long freeze up and thaw down pattern is common in Toledo, Ohio due to the changeable weather.

figure_3.jpg

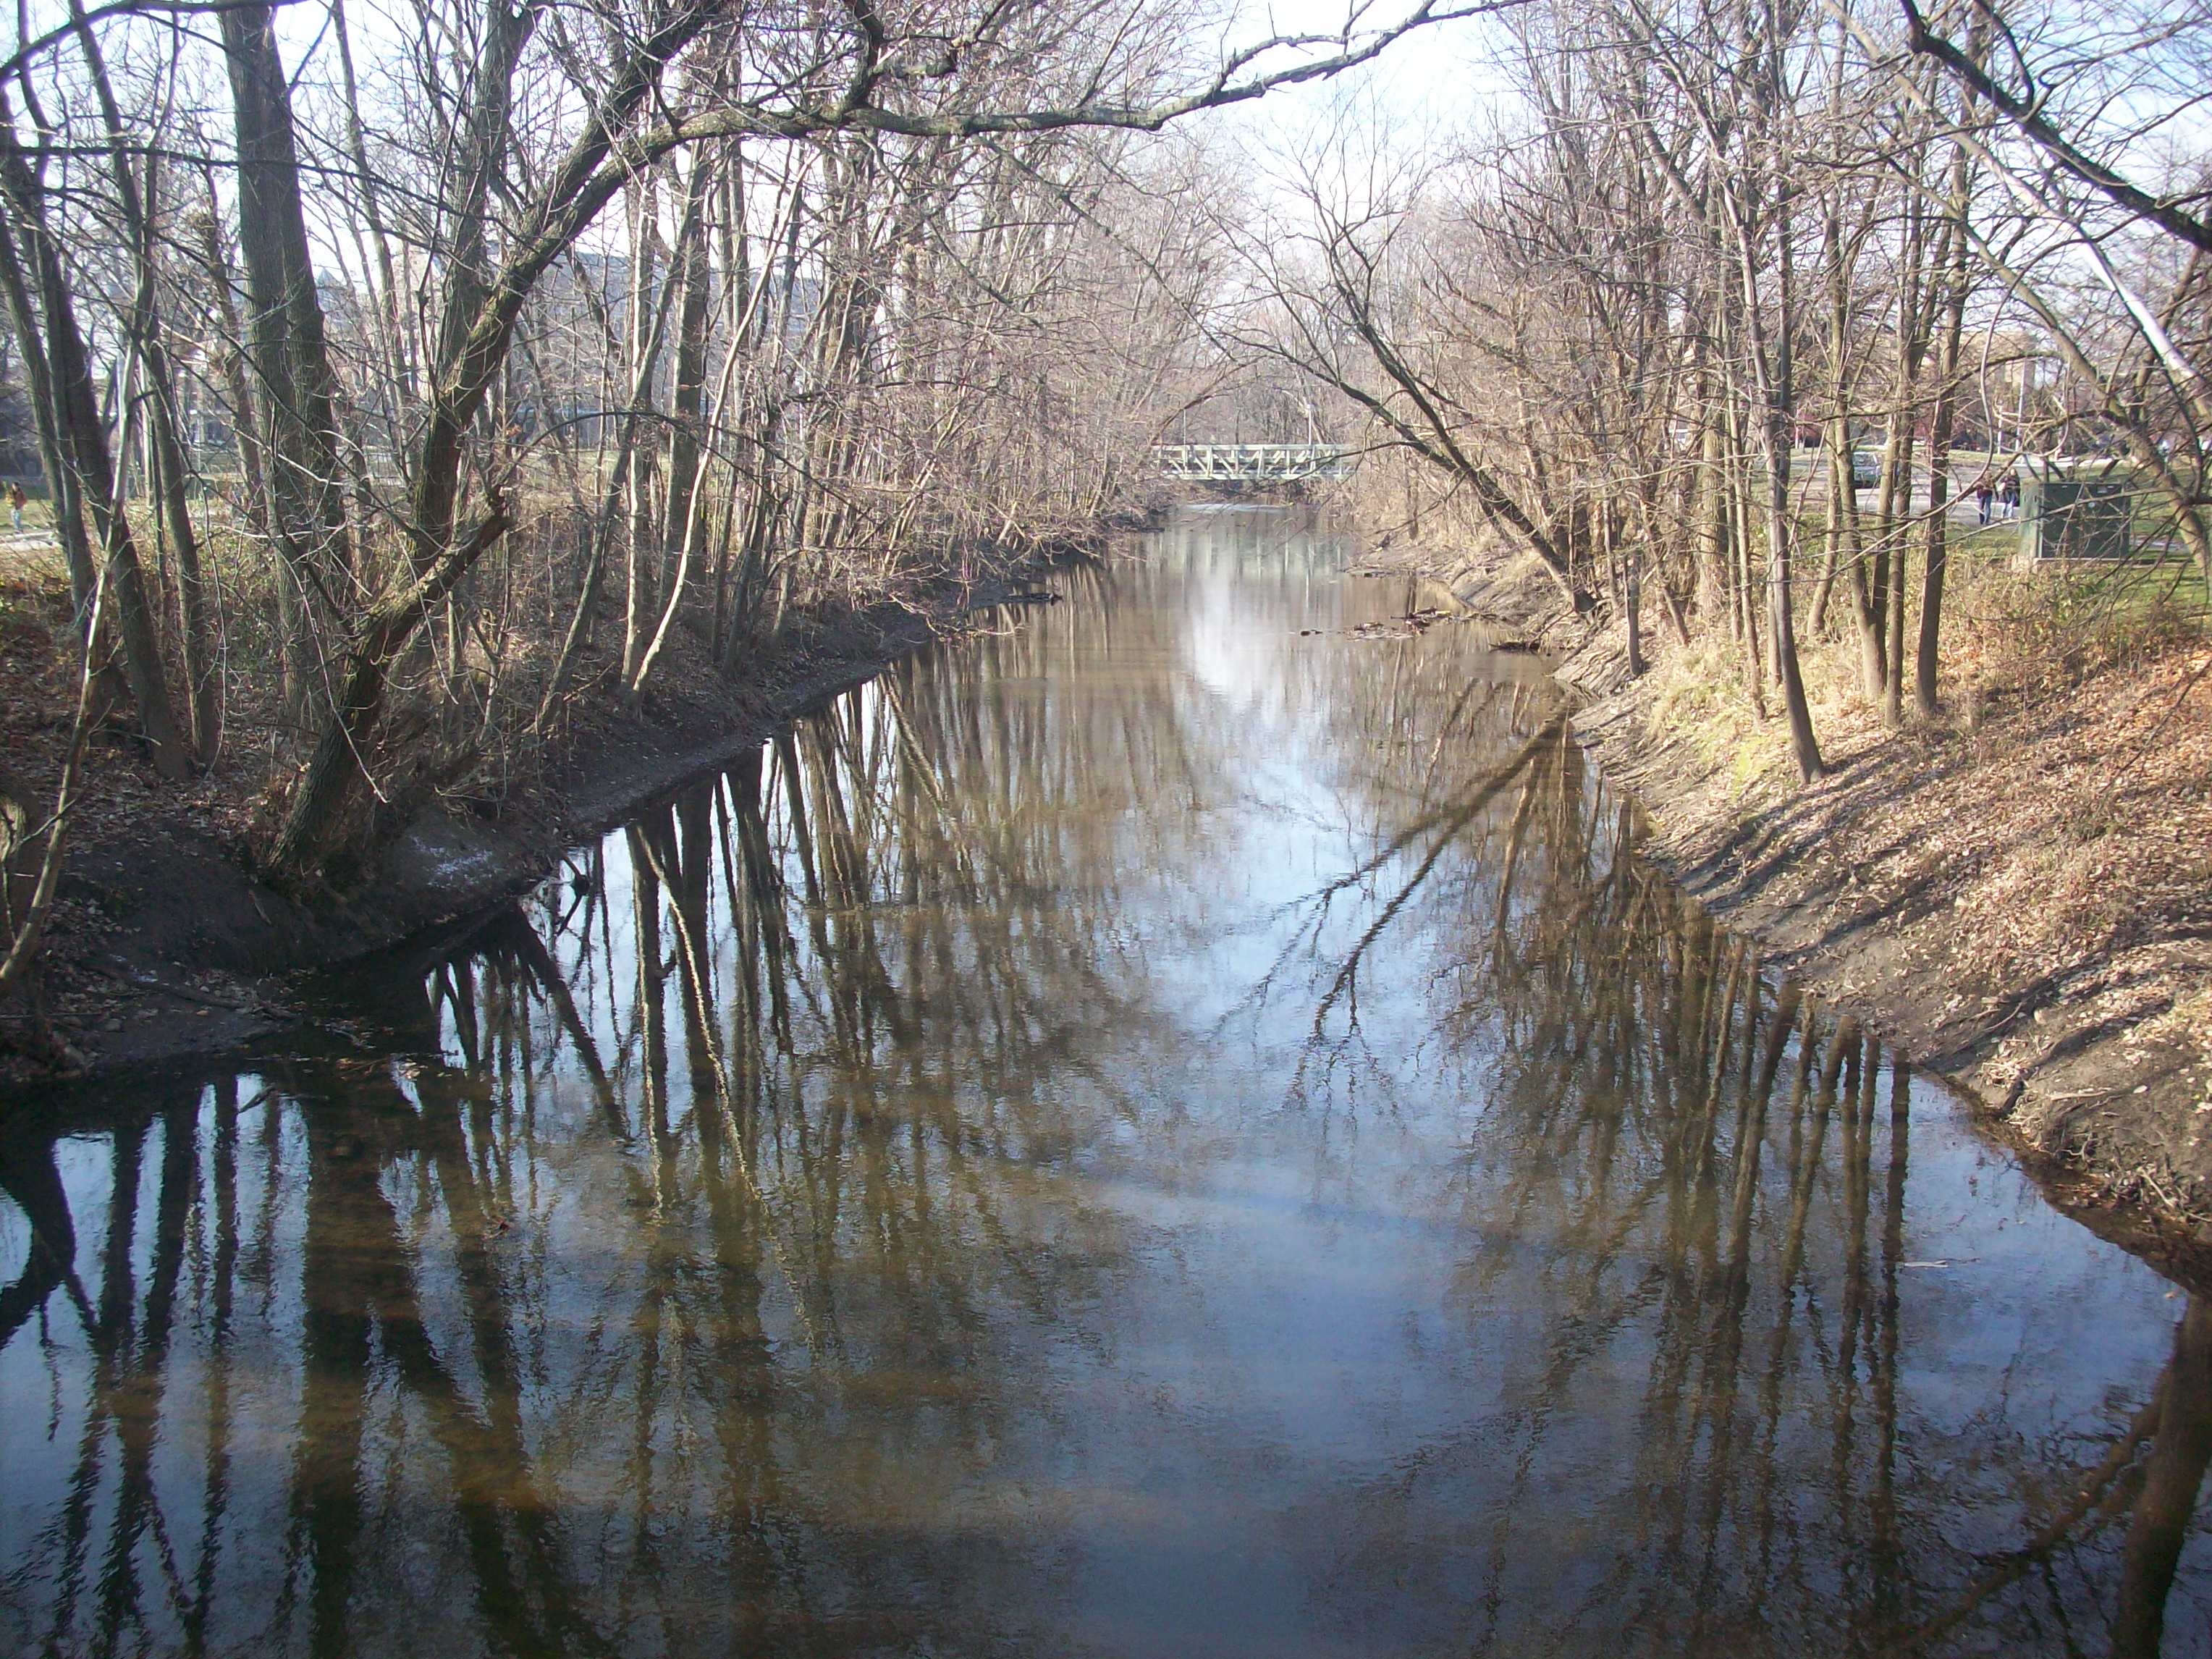
Figure 3. Ice on the Ottawa River, Toledo, Ohio, 3 December 2008

figure_41.jpg

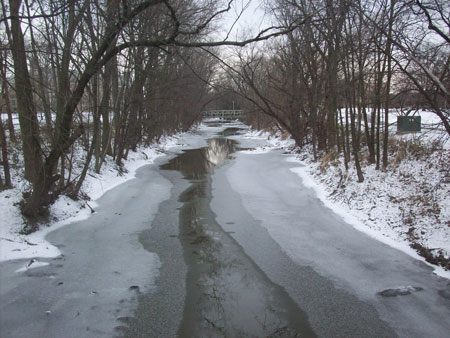
Figure 4. Ottawa River, 8 December 2008.

figure_51.jpg

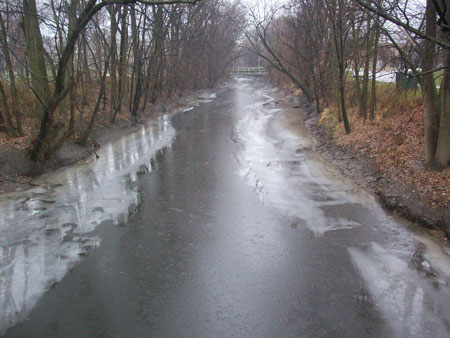
Figure 5. Ottawa River, 9 December 2008.

figure_61.jpg

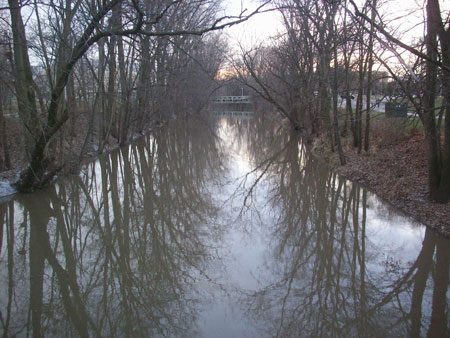
Figure 6. Ottawa River, 10 December 2008.

Here are schools that have entered data so far in the field campaign:
There have been 592 observations from 40 schools now recorded for the surface temperature field campaign. John Marshall High School in Glendale, WV has the most by far with 80 observations. Thanks Mrs. Clark, GO Monarchs! Peebles High School in Peebles, Ohio has logged 56 observations, thanks Mrs. Sheppard, and Dalton High School in Dalton, Ohio has reported 54, Thanks Mr. Witmer. And, thank you to all of the students from these schools.

Roswell Kent Middle School, Akron, OH, US [26 rows]
Dalton High School, Dalton, OH, US [54 rows]
Chartiers-Houston Jr./Sr. High School, Houston, PA, US [2 rows]
Lakewood Middle School, Hebron, OH, US [3 rows]
The Morton Arboretum Youth Education Dept., Lisle, IL, US [3 rows]
Peebles High School, Peebles, OH, US [56 rows]
Gimnazjum No 7 Jana III Sobieskiego, Rzeszow, PL [13 rows]
Penta Career Center, Perrysburg, OH, US [6 rows]
Canaan Middle School, Plain City, OH, US [20 rows]
Mill Creek Middle School, Comstock Park, MI, US [10 rows]
Brazil High, Brazil Village, TT [15 rows]
Kilingi-Nomme Gymnasium, Parnumaa, EE [16 rows]
Swift Creek Middle School, Tallahassee, FL, US [12 rows]
National Presbyterian School, Washington, DC, US [3 rows]
The Bryan Center, Bryan, OH, US [3 rows]
Maumee High School, Maumee, OH, US [12 rows]
Whittier Elementary School, Toledo, OH, US [4 rows]
Huntington High School, Huntington, WV, US [8 rows]
St. Joseph School, Sylvania, OH, US
Warrensville Heights High School, Warrensville Heights, OH, US [2 rows]
WayPoint Academy, Muskegon, MI, US
Gimnazium No 1, Sochaczew, PL [17 rows]
St. Michael Parish School, Wheeling, WV, US [4 rows]
Anthony Wayne High School, Whitehouse, OH, US [4 rows]
Bellefontaine High School, Bellefontaine, OH, US [20 rows]
Oak Glen High School, New Cumberland, WV, US [12 rows]
Nordonia Middle School, Northfield, OH, US [11 rows]
Orrville High School, Orrville, OH, US [6 rows]
Bowling Green Christian Academy, Bowling Green, OH, US [23 rows]
Polly Fox Academy, Toledo, OH, US [10 rows]
McTigue Middle School, Toledo, OH, US [3 rows]
Highlands Elementary School, Naperville, IL, US [8 rows]
South Suburban Montessori School, Brecksville, OH, US [20 rows]
NASA IV&V Educator Resource Center, Fairmont, WV, US
John Marshall High School, Glendale, WV, US [80 rows]
Birchwood School, Cleveland, OH, US [21 rows]
Orange Elementary School, Waterloo, IA, US
Hudsonville High School, Hudsonville, MI, US [19 rows]
The University of Toledo, Toledo, OH, US [25 rows]
Main Street School, Norwalk, OH, US [37 rows]

Dr. C