Archive for the ‘Watersheds’ Category

Part 5. Postscript to Missouri Puddles Blog

Tuesday, April 15th, 2008

(If you are interested in the Pole to Pole videoconference, just scroll down – it’s just below this one. I’m finishing up the puddles blog so that I can write a blog or two on inquiry, using the puddles as my example).

As I was proofreading the puddles blog upon returning to Colorado, I started wondering if the puddle simply had been left behind from the previous week’s rains, and that salt may have kept the puddle from freezing.

I had the opportunity to check this last week, on a second trip to Missouri. Again, there had been rain a few days before I arrived. And again, there was a puddle in the same place. But this time I could see clearly that water was flowing into the puddle (and other places along the road) from gaps in the curb as well as some in the street. You can see this in Figures 11 and 12.

puddle19mar08curb.jpg

Figure 11. A new puddle (photographed 19 March) at the same location of the one photographed in February, in Columbia, Missouri. Note that water is leaking through a gap in the curb as well as part of the crack.

I also discovered that the puddle was not in a dip in the road, as I had suspected earlier, but it was located in a place the road was nearly horizontal (okay, maybe a very shallow drip): There was actually some flow downhill toward the lowest spot, where water drained into a sewer. Finally, I discovered that the puddle is only about 2 meters (6.6 feet) above the lake.

puddlecloseup19mar08.JPG

Figure 12. Closeup of the puddle.

There were other puddles along the road, formed from drainage through gaps in the curb and sometimes gaps in the pavement of the road (most of the cracks in the roadbed are sealed with tar).

After a few days with temperatures rising to around 15 degrees Celsius (59 degrees Fahrenheit, the puddle finally disappeared. Where the water was, a white stain on the road revealed that salt had collected there; and there was drier soil carried along with the water feeding the puddle.

Another day with no puddles convinced me that the pipe connecting the fire hydrants (see earlier parts of this blog) was not leaking.

So, with a little extra data I was able to confirm the hypothesis that the puddle was being fed by subsurface water flowing at least through a gap in the curb (which is ~15 centimeters or 6 inches high) and possibly the crack in the road. Salt clearly also played a role in keeping the water from freezing.

I also found out something else. My brother and sister-in-law’s house was heated and cooled by pumping groundwater up to the house. Remember, the temperature 30 meters (100 feet) down – or even 10 meters (30 feet) down – is close to the average temperature for the whole year (in Columbia, about 13 degrees Celsius or 55 degrees Fahrenheit). So the water pumped up to the surface in the summer will be much cooler than the air temperature, and thus can be used to cool the house. In the winter, the ground water is almost always warmer than the house, so it can be pumped up to warm the house.

But remember – the temperature of the ground water – and the average temperature – is about 13 degrees Celsius (55 degrees Fahrenheit). That’s not warm enough to heat the house in winter, so another method is needed to bring the temperature up from 13 degrees to a more comfortable 20 degrees Celsius (68 degrees Fahrenheit) or so.

Next time: how the investigation of this puddle illustrates the inquiry process – or the “scientific method.”

Watersheds Part 3

Tuesday, January 29th, 2008

On the surface, we have something similar called “watersheds.” If the water isn’t soaking into the ground, hills act like our roofs, and the water flows on the surface until it hits a stream or river.

If you look at a stream, it is surrounded by higher ground. If you include all the ground that is feeding that stream, this area is the stream’s watershed. Let’s think a bit about what we know regarding watersheds:

  1. If the amount of precipitation is the same, more water flows out of bigger watersheds. Like bigger roofs shed more water.
  2. In big watersheds, it takes time for the water to flow out. Unlike our roof example, we cannot assume that the flow will be fastest when there is heavy rain upstream. In fact, it will take awhile for the rain to reach the outlet or mouth of the watershed.
  3. If the rain is light and the ground is dry, the ground might “soak up” the rain – and you might not see a change in the river or stream flowing out of its watershed. (This works in our roof example only if you are unfortunate enough to have a very leaky roof!).

Figure 4 shows an example of a watershed that I have studied. This is the Walnut River watershed, southeast of Wichita, Kansas. All the water falling on the area outlined flows into the Walnut River, which empties at the bottom of the picture.

figure4.JPG

Figure 4. The Walnut River watershed, which lies east of Wichita, Kansas, USA. Gray lines are contours; a red solid line outlines the watershed, and blue solid lines show the Walnut River and its tributaries.

This watershed measures 100 km from north to south, and about 60 km from east to west – a lot larger than the roofs.

A few years ago, scientists at Northern Illinois University and Argonne National Laboratory estimated the water budget of this watershed.

What does this mean? In simple terms:

All the water coming into the watershed = All the water going out of the watershed

It would be easy to do this if all you had to worry about was:

Rain falling in the watershed = Rain flowing out of the watershed

But it’s much more complicated, since

  1. The water might evaporate before it leaves the watershed, and
  2. Water will soak into the soil, and
  3. Water might flow deeper underground – that is, the watershed might “leak.”

In fact, all of these things happened in the Walnut River watershed. And these things can be complicated.For example, the amount of water evaporating or soaking into the soil changes with the surface. In Figure 5, grasslands are shown in green. Much of the area not colored is covered with crops (mostly winter wheat).

What would happen to rainfall in the late summer when the grass covers the ground but the winter wheat has been harvested? Do you think more water will run off the fields of harvested wheat? What about plowed fields?

figure5.gif

Figure 5. Contour map of the Walnut River watershed (outlined) with grasslands shaded in green.

Now think about the cities and towns. Figure 6 shows some of the larger towns in the same area.

figure-6u_l_walnut_river_ws.JPG

Figure 6. Map showing the upper (top) and lower (bottom) Walnut River watershed. Each small square is a mile (1.6 km) on a side.

Everywhere there is yellow, there is a city. The big yellow spot to the left (west) is Wichita. Much of Wichita is covered with concrete. Now think about what happens with a heavy rain? How much water would soak into the ground in Wichita, compared to the grassy areas farther to the east?

Now, think about the future. How much water would soak in if there were more cities, and the cities were bigger?

Clearly, what we do can affect the amount of water leaving the watershed.

Think about the watershed where you live. And watch for more about watersheds in the future: Visit the GLOBE Watershed Dynamics Earth System Science Project (ESSP) to find out more about this project and announcements for upcoming workshops. This project will be examining the flow of water through a watershed and how humans are impacting runoff and stream flow.

Icicles and Watersheds Part 2: How much water flows off the top of two houses

Monday, January 14th, 2008

What about the total amount of water coming off the roof? Suppose it is raining, so insulation doesn’t make any difference. Again, about twice as much water would flow off a given spot along the eaves for our house. But the total amount of water flowing off one side of the house is determined by the total area of the roof upstream.

Consider the one-meter section of our house in Figure 2. Let’s estimate how much water would flow off a meter length on the east side for a rainfall of 1 centimeter per hour. The roof measures 10 meters from the top to the eaves.

In an hour, the volume of water falling on the roof would be 1 centimeter per hour or 0.01 meters per hour × 1 meter × 10 m, or 0.1 cubic meter of water per hour. Since water weighs 1 gram per cubic centimeter and there are 100 x 100 x 100 x 0.1 cubic centimeters in 0.1 cubic meter, about 100 kilograms of water fall on this one-meter section of the roof per hour. The same amount flows over a meter section of the eaves to the ground in about an hour (assuming the roof drains as fast as it rains!)

But we need to make a minor correction for the fact that the roof is not exactly horizontal (i.e., it’s covering less ground).

If the angle of the roof to the ground is 20 degrees, we need to multiply the 100 kilograms of water per hour per 1 meter by 0.94, making the total rainfall 94 kilograms.

If the roof measures 10 meters along the eaves and top of the roof (Figure 3), the total amount of water flowing off the roof on the east side is 10 times that amount, or 940 kilograms allowing for the angle of the roof.

What about the roof of the imaginary house in Figure 3, which measures 5 meters from the top of the roof to the eaves? Half as much water or 47 kilograms falls on a one-meter slide of this house (Figure 2) each hour, so half as much water will flow off the eaves per meter each hour compared to our house, which measures 10 meters from roof to eaves. We assume the roof’s angle to the ground is the same as our house.

The total amount of water flowing off the roof of the imaginary house each hour would then be:

47 kilograms per 1 meter along the eaves times 20 meters, or 940 kilograms flowing off the east side of the roof each hour. This is of course the same amount of water flowing off our house.

Did you notice that if you just know that the area and angle of the roof of the imaginary house are the same as the roof as our house, means that the total amount of rain falling on both houses is the same, and therefore the same amount of water flowing off the two roofs is the same?

We could call these roofs “roof watersheds” or “roofsheds” because they shed water – in the form of icicles in the first example, or in the form of liquid in the second.

figure3.gif

Figure 3. “Roofsheds” for our house and the imaginary house, viewed from above. Both roofs, having the same area (100 square meters) and angle to the ground (20 degrees), will shed the same amount of water on the east side, where the eaves are.

Icicles and Watersheds: Part 1

Wednesday, January 9th, 2008

Why are the icicles so long on our house?

On a recent walk just a day or two after our first snow, my husband and I noticed that we had the longest icicles in the neighborhood. Some houses built the same time as our house had icicles, but they were shorter. One new house had almost no icicles.

But what was the most fun, was our own house. The picture below shows our “champion” icicles.

Sketch of icicles on the east side of our house

Figure 1. Sketch of icicles on the east side of our house. The windows to the right of the icicles are about 1 meter high. The part to the right is the front part of the house; the part to the left is the back part of the house.

Notice that the icicles only cover the middle third of the side of the house. To the right and to the left, there are no icicles. Were we to walk on the roof, we would probably find the snow melted in the middle third of the roof, but not on the sides.

Why? Our house was built in stages. The front two-thirds were built were built in 1950. There was little insulation in the roof. A few months before I made this sketch, we tore out the old ceiling in the room in the front of the house and found that the insulation from 1950 was in poor condition, just like the insulation in the middle of house. The new insulation was much better. The picture confirms that the new insulation was working. No icicles implies no water from melting snow. This means that little heat was escaping through the roof, so there was little or no snowmelt on the roof.

Similarly, the back part of the house was built in 1979. When that part of the house was built, we made sure we had good thick insulation in the roof. There are no icicles on the new part of the house. Again – the insulation must be working.

Using the data from our house, can we explain why our house had the longest icicles? I’m guessing that the new house in our neighborhood that had almost no icicles had good insulation – just like the newer parts of our house and the room we just insulated. We could that the snow on the roof of the new house was fairly deep – there was little melting.

What about the older houses with shorter icicles? Let’s imagine an older house with about the same insulation as the old parts of our house (Figure 2). If this is true, the snow would melt at about the same rate (I am assuming that the roof was exposed to the same amount of sunlight per unit area). Why then would the icicles be shorter on the other (imaginary) house?

If you believe my assumptions, the answer is that the area of the roof “draining” toward the eaves (where the icicles grow) was smaller. Say the distance from the top to the icicles on our imaginary house is 5 meters, and the distance on our house is 10 meters. As the melted snow moves down from the top of the roof to the eaves, twice as much water reaches a given length along the eaves for the 10-meter roof (ours) compared to the five-meter roof. It follows that the icicles on our house would contain twice as much water and be longer than on the other house. The icicles may be not twice as long, because the icicles we had might be wider as well as longer.

View of a slice of our house (top)

Figure 2. View of a one-meter slice of our house (top) and an imaginary neighborhood house (bottom). More water is available to flow over the eaves for our house. We are looking at the two houses from the north.

So the amount of water in the icicles is determined by the amount of snow upstream of (or straight up the roof from) the eaves.

Puddles

Tuesday, May 29th, 2007

I like puddles, and I have become more interested in them lately. Why?

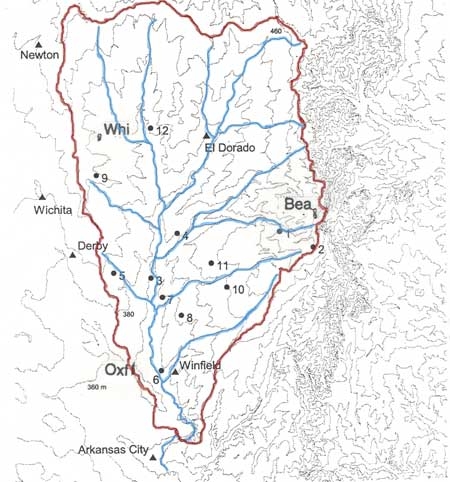
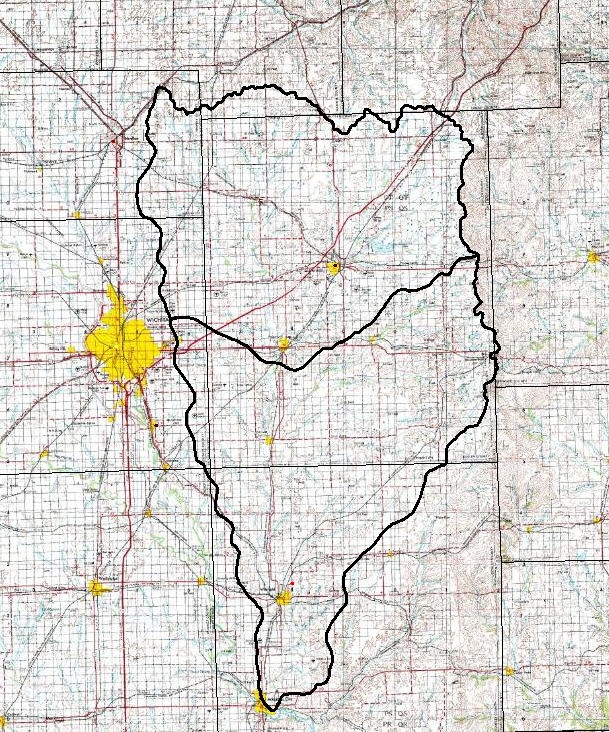
On 29 May 2002, we took observations of the heating and moistening of the lower atmosphere using an aircraft and surface sites observations in the Oklahoma Panhandle (The Western Track in Figure 1). Two days before we took our data, a heavy rain brought 80 mm of rain to the point labeled 1, with the points labeled 2, 3, and 10 getting 30 mm or less.

Map showing the location of aircraft flight tracks

Figure 1. Map showing the location of aircraft flight tracks (white lines) and sites where we took special measurements (numbered 1-10). The observations I write about are along the Western Track, on the left side of the picture. The long white lines outline part of the state of Oklahoma.

We have been trying to see how well a land surface model would do in predicting the observed heating and moistening, given the weather conditions – temperature, solar radiation, wind, rainfall, and so on as input. And the model didn’t work very well near Site 1. No matter what we did.

We have an idea why: Puddles.

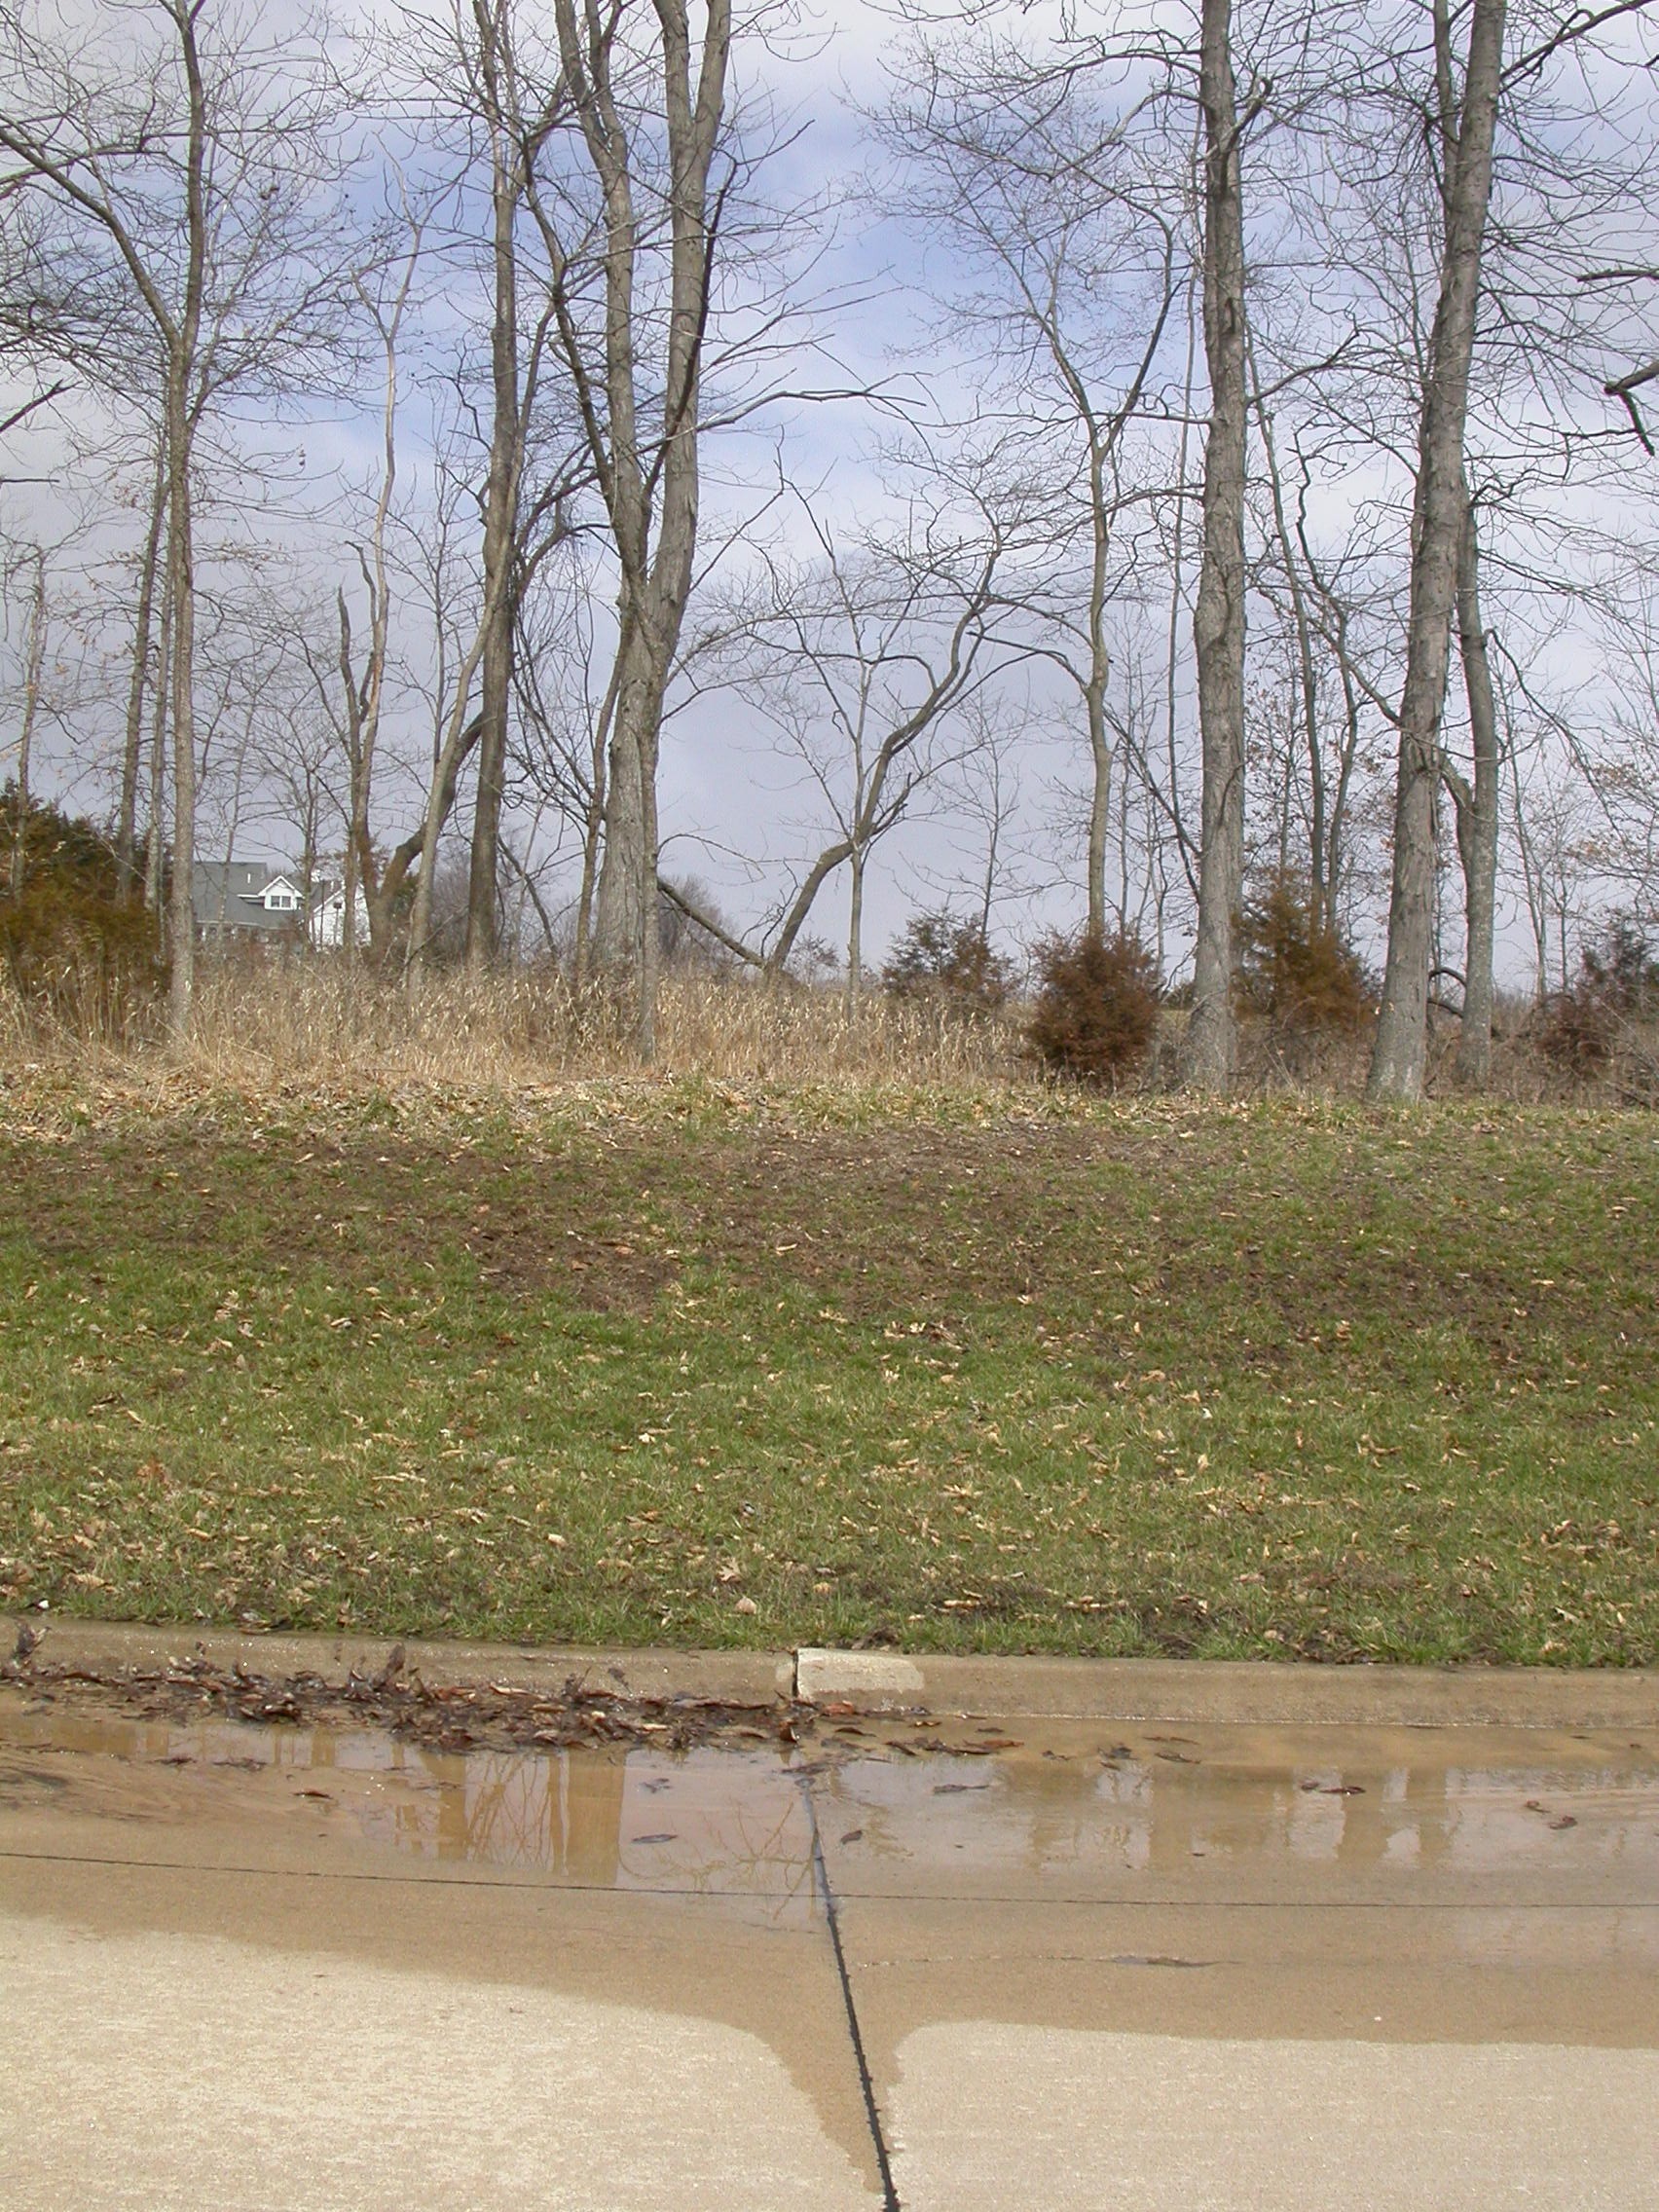
As you can see from Figure 2, there were puddles near the southern end of the flight track. In fact, one road was blocked by water. And the land surface model didn’t account for evaporation from puddles. We think this could explain why the measurements showed more moistening (and less heating) of the air than the model did.

Photograph of puddles near the southern end

Figure 2. On 29 May 2002, photograph of puddles near the southern end of the Western Track, shown in Figure 1. The spots are on the aircraft windshield.

I decided that I had better learn more about puddles. So the first day there were puddles outside my office, I went outside and took puddle temperatures with a GLOBE infrared sensor (see the GLOBE Surface Temperature Protocol).

I was surprised – the puddles were warm compared the ground around them. This is not what I expected. Puddles like those in Figure 2 were cooler than the surrounding ground on 29 May. So I became even more excited about puddles. There is nothing more fun – and sometimes more awful! – than taking measurements you don’t understand.

I’m starting this project by just trying to figure out how fast the puddle disappears. On an asphalt surface, this tells me how fast the puddle evaporates. I’m also measuring the temperatures of the surface around the puddles.

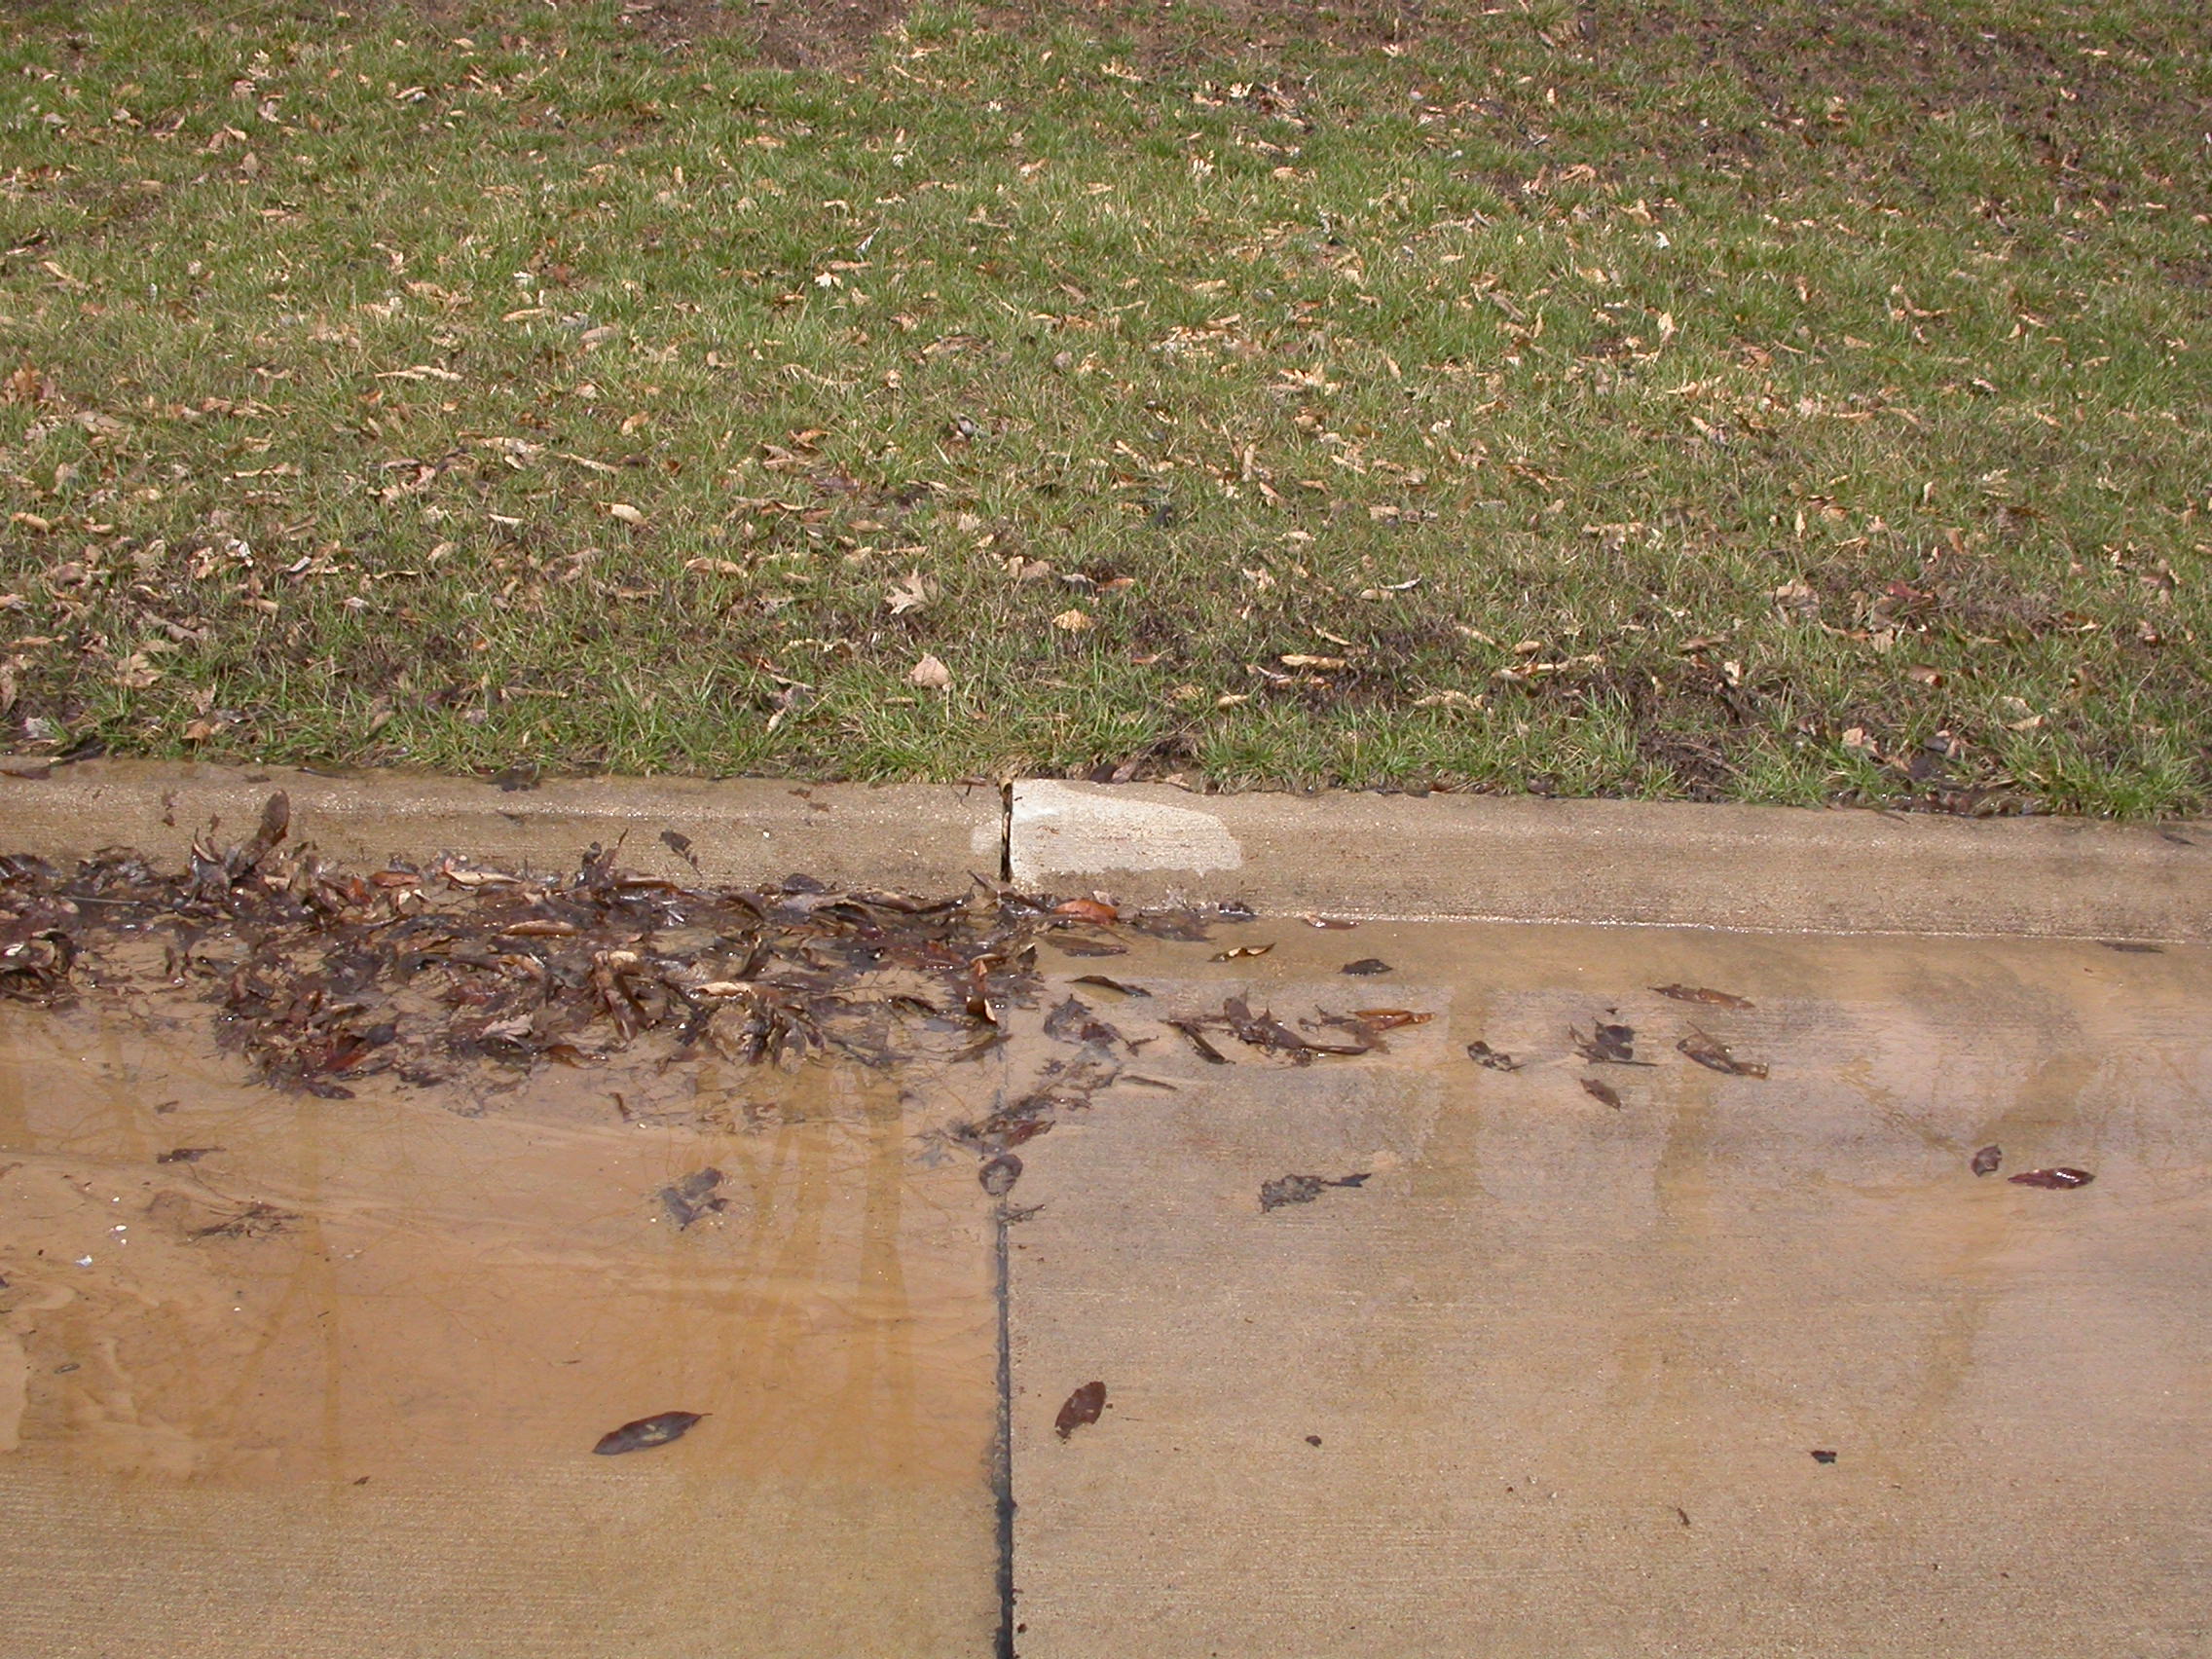
Figure 3 is a picture of the puddle that I measured. The chalk rings are drawn around the puddle so that I can see how fast it is drying out.

Puddle with outlines of water's edge

Figure 3. Puddle with outlines of water’s edge. The lines alternate between light yellow and light pink. Yellow or pink dashed lines are where the chalk is too light to see easily. By the time this picture was taken, the puddle was almost gone, with shallow water in a few places in the small left circle. Times are when the lines were drawn. UTC = MDT + 6 hours.

What did I learn? Figure 4 showed results more like what I had expected. As the sun got higher in the sky, the asphalt surrounding the puddle warmed more than the puddle itself. And the difference between the puddle temperature and the asphalt temperature got bigger, until around 11 a.m., when it started to get cloudy. After that, the temperature difference became smaller.

Graph of temperature of the puddle

Figure 4. Temperature of the puddle in Figure 3 as a function of time. The skies were mostly clear until about 11 a.m. MDT. After that, the sky got cloudier with time. It was overcast by 11:50. Local solar noon (when the Sun is highest in the sky) is around 13 MDT.

Does this offer a clue to why the first puddle I looked earlier at was warmer than the surrounding surface? I think it does. That day, it was also cloudy in the afternoon.

If this puddle had lasted longer, AND if this puddle cooled more slowly than the dry asphalt once the skies were cloudy, then this puddle might have ended up warmer than the asphalt. And maybe it has something to do with the fact that water stores heat well.

So I need to look at more puddles. And, while doing this simple experiment, I noticed that I could have done some things better:

  • I didn’t want to use the oven mitt on the radiation thermometer, as recommended for the GLOBE Surface Temperature Protocol, so I kept the radiation thermometer outside so that its temperature was the same as the air temperature. But I soon discovered that the air temperature where I kept the radiation thermometer was different enough from the puddle site that the measured surface temperature changed rather rapidly for about five minutes (the differences weren’t that bad). So I’m not too sure about the temperatures before 8 a.m. After 8 a.m., I still left the instrument outside but oven mitt on – and the measurements were more consistent.
  • Toward the end of the observations, I realized that I had made a bad assumption: that all the asphalt outside the puddle was the same. It wasn’t. The puddle was in a place that had been repaired. You can see the difference in Figure 5. The area to the north of the puddle was up to 3 degrees cooler than the area to the south of the puddle! ). So I only use the temperatures on the south side in Figure 4.
  • I had carefully drawn chalk rings around the puddle, so that I could see how fast it evaporated. But I forgot to take an important observation – how deep the puddle was! So – even though I could tell that the puddle was evaporating, I couldn’t tell how much water was evaporating – and I wanted to know that.
  • If clouds are important, as they would be if the puddle stays warm after the skies cloud over, but the surface around it cools off – I need to be more careful about writing down when there were clouds.
  • Fourth, once the puddle got quite shallow, it was basically wet asphalt. I should have taken the temperature of the wet asphalt as well.

The puddle and its environment

Figure 5. The puddle and its environment. Note the puddle lies on the south (right) end of an asphalt square that was slightly warmer than the darker asphalt to the right. (Although dark things are usually warmer than white things, the warm temperature could have something to do with different materials being used, or the thickness of the asphalt layer.)

I have some of the other data below. You’ll notice I may have made a few mistakes! (It’s important to keep track of them, so you can learn from them). The times are important because I might want to check other weather data I can get from the Web or from the automatic weather station on top of our building.

Next time I will be more thorough. I’ll let you know what happens. In the meantime, think about how you can use measurements or simple observations to describe some things that are happening around your home or school.

Table: Puddle measurements on 6 May 2007.

Time (LDT) Cloud Comments
0743 Clear Photos 7:50 of puddle.
0845 Clear First Ring
0945 - Second Ring; took photo.
1045 0.4 Cu Drew third ring; took photo
1115 Broken Cu Drew 3 yellow circles where water still is. Got cloudy after second reading. Photo.
1125 - Puddle almost gone. I take temperature measurements just to show how much they vary around and in where the puddle was.
- - Note temperatures on patch of asphalt to the north are cooler than temperature on the original asphalt to the south.
1150 Cloudy Used average temperatures just for south for time series since just started taking measurements to the north (don’t have complete record).
1220 Cloudy I recorded a temperature north of the puddle that was warmer than the temperature to the south of the puddle. I wonder if the readings are just reversed?
1225 Cloudy Puddle basically gone