Archive for January, 2008

Watersheds Part 3

Tuesday, January 29th, 2008

On the surface, we have something similar called “watersheds.” If the water isn’t soaking into the ground, hills act like our roofs, and the water flows on the surface until it hits a stream or river.

If you look at a stream, it is surrounded by higher ground. If you include all the ground that is feeding that stream, this area is the stream’s watershed. Let’s think a bit about what we know regarding watersheds:

  1. If the amount of precipitation is the same, more water flows out of bigger watersheds. Like bigger roofs shed more water.
  2. In big watersheds, it takes time for the water to flow out. Unlike our roof example, we cannot assume that the flow will be fastest when there is heavy rain upstream. In fact, it will take awhile for the rain to reach the outlet or mouth of the watershed.
  3. If the rain is light and the ground is dry, the ground might “soak up” the rain – and you might not see a change in the river or stream flowing out of its watershed. (This works in our roof example only if you are unfortunate enough to have a very leaky roof!).

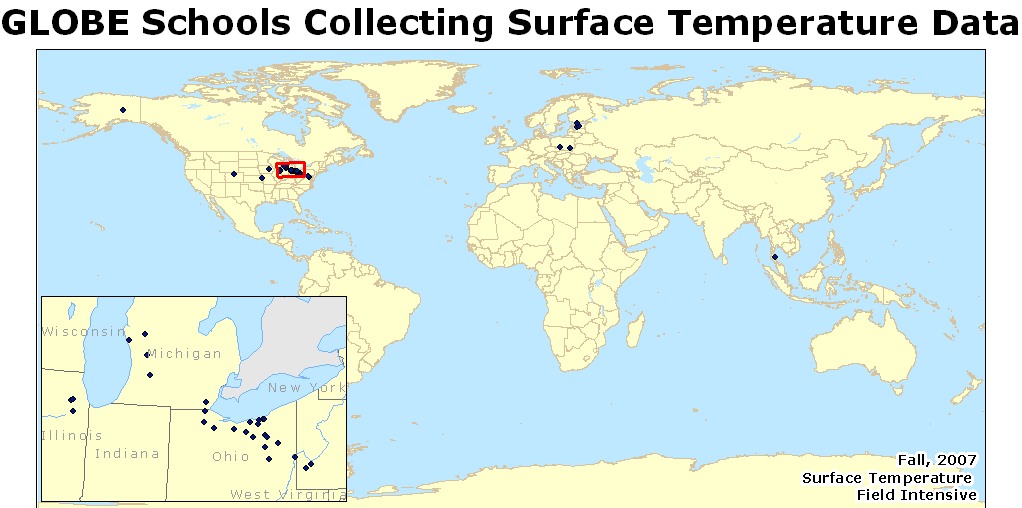
Figure 4 shows an example of a watershed that I have studied. This is the Walnut River watershed, southeast of Wichita, Kansas. All the water falling on the area outlined flows into the Walnut River, which empties at the bottom of the picture.

figure4.JPG

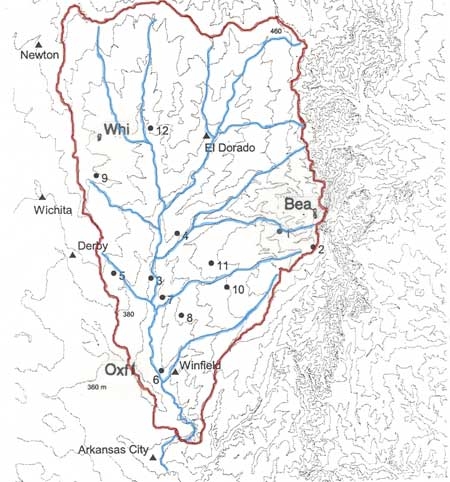
Figure 4. The Walnut River watershed, which lies east of Wichita, Kansas, USA. Gray lines are contours; a red solid line outlines the watershed, and blue solid lines show the Walnut River and its tributaries.

This watershed measures 100 km from north to south, and about 60 km from east to west – a lot larger than the roofs.

A few years ago, scientists at Northern Illinois University and Argonne National Laboratory estimated the water budget of this watershed.

What does this mean? In simple terms:

All the water coming into the watershed = All the water going out of the watershed

It would be easy to do this if all you had to worry about was:

Rain falling in the watershed = Rain flowing out of the watershed

But it’s much more complicated, since

  1. The water might evaporate before it leaves the watershed, and
  2. Water will soak into the soil, and
  3. Water might flow deeper underground – that is, the watershed might “leak.”

In fact, all of these things happened in the Walnut River watershed. And these things can be complicated.For example, the amount of water evaporating or soaking into the soil changes with the surface. In Figure 5, grasslands are shown in green. Much of the area not colored is covered with crops (mostly winter wheat).

What would happen to rainfall in the late summer when the grass covers the ground but the winter wheat has been harvested? Do you think more water will run off the fields of harvested wheat? What about plowed fields?

figure5.gif

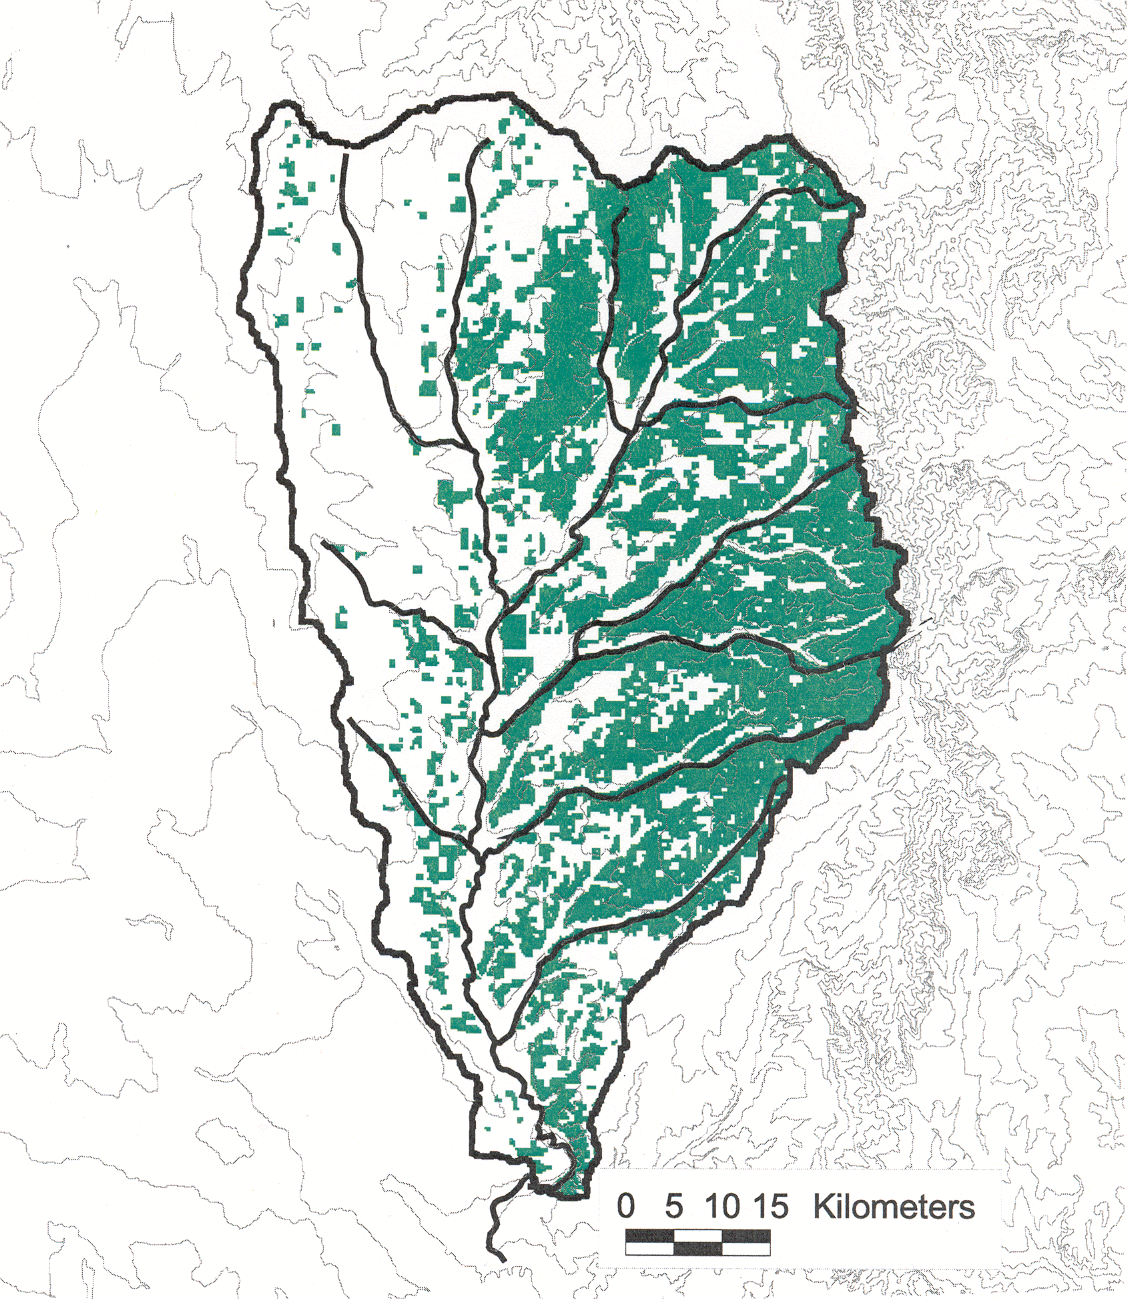
Figure 5. Contour map of the Walnut River watershed (outlined) with grasslands shaded in green.

Now think about the cities and towns. Figure 6 shows some of the larger towns in the same area.

figure-6u_l_walnut_river_ws.JPG

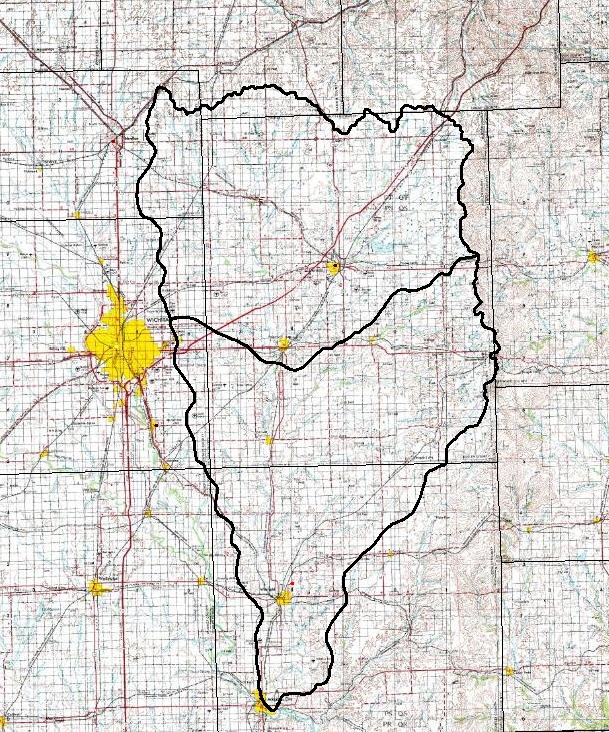
Figure 6. Map showing the upper (top) and lower (bottom) Walnut River watershed. Each small square is a mile (1.6 km) on a side.

Everywhere there is yellow, there is a city. The big yellow spot to the left (west) is Wichita. Much of Wichita is covered with concrete. Now think about what happens with a heavy rain? How much water would soak into the ground in Wichita, compared to the grassy areas farther to the east?

Now, think about the future. How much water would soak in if there were more cities, and the cities were bigger?

Clearly, what we do can affect the amount of water leaving the watershed.

Think about the watershed where you live. And watch for more about watersheds in the future: Visit the GLOBE Watershed Dynamics Earth System Science Project (ESSP) to find out more about this project and announcements for upcoming workshops. This project will be examining the flow of water through a watershed and how humans are impacting runoff and stream flow.

Icicles and Watersheds Part 2: How much water flows off the top of two houses

Monday, January 14th, 2008

What about the total amount of water coming off the roof? Suppose it is raining, so insulation doesn’t make any difference. Again, about twice as much water would flow off a given spot along the eaves for our house. But the total amount of water flowing off one side of the house is determined by the total area of the roof upstream.

Consider the one-meter section of our house in Figure 2. Let’s estimate how much water would flow off a meter length on the east side for a rainfall of 1 centimeter per hour. The roof measures 10 meters from the top to the eaves.

In an hour, the volume of water falling on the roof would be 1 centimeter per hour or 0.01 meters per hour × 1 meter × 10 m, or 0.1 cubic meter of water per hour. Since water weighs 1 gram per cubic centimeter and there are 100 x 100 x 100 x 0.1 cubic centimeters in 0.1 cubic meter, about 100 kilograms of water fall on this one-meter section of the roof per hour. The same amount flows over a meter section of the eaves to the ground in about an hour (assuming the roof drains as fast as it rains!)

But we need to make a minor correction for the fact that the roof is not exactly horizontal (i.e., it’s covering less ground).

If the angle of the roof to the ground is 20 degrees, we need to multiply the 100 kilograms of water per hour per 1 meter by 0.94, making the total rainfall 94 kilograms.

If the roof measures 10 meters along the eaves and top of the roof (Figure 3), the total amount of water flowing off the roof on the east side is 10 times that amount, or 940 kilograms allowing for the angle of the roof.

What about the roof of the imaginary house in Figure 3, which measures 5 meters from the top of the roof to the eaves? Half as much water or 47 kilograms falls on a one-meter slide of this house (Figure 2) each hour, so half as much water will flow off the eaves per meter each hour compared to our house, which measures 10 meters from roof to eaves. We assume the roof’s angle to the ground is the same as our house.

The total amount of water flowing off the roof of the imaginary house each hour would then be:

47 kilograms per 1 meter along the eaves times 20 meters, or 940 kilograms flowing off the east side of the roof each hour. This is of course the same amount of water flowing off our house.

Did you notice that if you just know that the area and angle of the roof of the imaginary house are the same as the roof as our house, means that the total amount of rain falling on both houses is the same, and therefore the same amount of water flowing off the two roofs is the same?

We could call these roofs “roof watersheds” or “roofsheds” because they shed water – in the form of icicles in the first example, or in the form of liquid in the second.

figure3.gif

Figure 3. “Roofsheds” for our house and the imaginary house, viewed from above. Both roofs, having the same area (100 square meters) and angle to the ground (20 degrees), will shed the same amount of water on the east side, where the eaves are.

Surface Temperature Field Campaign - Summary

Thursday, January 10th, 2008

Below you will find Dr. Kevin Czajkowski’s summary of the participation in his surface temperature field campaign. We at GLOBE join Kevin is his sincere thanks for your help!

8 January 2008

Thank you for your participation in the 2007 GLOBE Surface Temperature Field Campaign.

The surface temperature field campaign is completely over. I think that every student and teacher who was going to enter observations has done so. We had over 1100 total observations. That is wonderful. As you know, each complete observation represents 9 surface temperature observations, 9 snow depth, cloud cover and cloud type, condensation trail cover and type, surface wetness, and cover type for a total of 24 observations per complete surface temperature observation. That means that there were over 26,000 individual student observations for the campaign. That is impressive!

A total of 40 schools participated from the United States, Estonia, Thailand, Poland and from the following states in the United States Ohio, Pennsylvania, West Virginia, Michigan, Iowa, Alaska, Illinois, Kansas and Colorado. The school with the largest number of observations was Roswell Kent Middle School in Akron, Ohio with 75 observations. A close second was Kilingi-Nomme Gymnasium in Parnumaa, Estonia (72 observations), Gimnazium in Toszek, Toszek, Poland (69 observations), Waynesboro Senior High School, Waynesboro, Pennsylvania (69 observations), Dalton High School, Dalton, Ohio (67 observations) and Rockhill Elementary School, Alliance, Ohio with 61 observations. Even if your school only entered one observation, every observation is important and your contribution to the project is greatly appreciated.

tsschools2.jpg

Figure 1. Map of schools participating in the surface temperature field campaign.

I wanted to give you a little update on how things were going around my house. In late December, my frost tube showed that the ground was frozen to about 10 cm in depth. But, then, on New Year’s Eve, temperatures warmed up and melted the frost. I was actually with my family about two hours drive north in Michigan visiting family when it snowed 38 cm (15 inches) New Year’s Eve and New Year’s Day morning. I tried to drive my van out of the side road to a main road. Unfortunately, the snow was too deep and the van got stuck several times. I used a shovel to dig the van out and finally gave up and parked in a neighbor’s driveway. This was the first time in my life I had been stuck in the snow. Having grown up near Buffalo, NY where there is lots of snow in the winter, I prided myself on being a good winter driver. Of course, it wasn’t poor driving skills that got us stuck. It was the fact that the snow was so deep. We finally made it out and got to our house near Toledo, Ohio later that night.

That storm produced only rain in Toledo, Ohio. Then, 7 cm (3 inches) of snow fell on New Year’s Day at our house near Toledo. After that, temperatures dropped to –13º C (8º F) two nights in a row. Interestingly, due to the 7 cm of snow on the ground, the frost tube showed no ice below the ground surface. The snow had insulated the ground from the cold.

Then, there were extremely warm temperatures January 6-9, 2008 in Toledo, Ohio and much of the eastern United States. On Monday, Toledo reached a record high of 19º C (66º F). The old record temperature was 16º C (61º F) that was set in 1907. All of the snow and ice has melted around here. But, the weather forecast models show that temperatures are going to drop again below freezing.

Schools involved in the surface temperature field campaign to date:

Roswell Kent Middle School, Akron, Ohio, USA - 75 observations
Rockhill Elementary School, Alliance, Ohio, USA - 61 observations
Dalton High School, Dalton, Ohio, USA - 67 observations
Chartiers-Houston Jr./Sr. High School, Houston, Pennsylvania, USA - 12 observations
Cloverleaf High School, Lodi, Ohio, USA - 38 observations
The Morton Arboretum Youth Education Dept., Lisle, Illinois, USA - 16 observations
Mill Creek Middle School, Comstock Park, Michigan, USA - 14 observations
Kilingi-Nomme Gymnasium, Parnumaa, Estonia - 72 observations
Polaris Career Center, Middleburg Heights, Ohio, USA - 1 observation
National Presbyterian School, Washington, DC, USA - 9 observations
White Cloud Public, White Cloud, Michigan, USA - 44 observations
Blue Valley High School, Stilwell, Kansas, USA - 5 observations
Perkins Middle School, Akron, Ohio, USA - 19 observations
Steeple Run School, Naperville, Illinois, USA - 4 observations
Kittrell Elementary School, Waterloo, Iowa, USA – 4 observations
Tallinn Science Secondary School, Tallinn, Estonia - 68 observations
Oak Glan High School, New Cumberland, West Virginia, USA - 19 observations
Lorain Community College Early College High School, Elyria, Ohio, USA - 52 observations
Ingomar Middle School, Pittsburgh, Pennsylvania, USA - 13 observations
Moosewood Farm Home School, Fairbanks, Alaska, USA - 21 observations
Roxboro Middle School, Cleveland Heights, Ohio, USA - 16 observations
Bowling Green State University, Bowling Green, Ohio, USA - 50 observations
Walailak University, Nakhon Si Thammarat, Thailand - 4 observations
Massillon Middle School, Massillon, Ohio, USA - 10 observations
Ida Elementary School, Ida, Michigan, USA - 14 observations
Whitehall High School, Whitehall, Michigan, USA - 56 observations
Taaksi Basic School, EE2914, Viljandimaa, Estonia - 16 observations
Midview West Elementary School, Grafton, Ohio, USA - 12 observations
Birchwood School, Cleveland, Ohio, USA - 47 observations
Gimnazium in Toszek, Toszek, Poland – 69 observations
Gimnazjum No 7 Jana III Sobieskiego, Poland - 35 observations
Waynesboro Senior High School, Waynesboro, Pennsylvania, USA - 68 observations
Eastwood Middle School, Pemberville, Ohio, USA - 16 observations
Orange Elementary School, Waterloo, Iowa, USA - 8 observations
Estes Park High School, Estes Park, Colorado, USA - 4 observations
Hudsonville High School, Hudsonville, Michigan, USA - 37 observations
Highlands Elementary School, Naperville, Illinois, USA - 5 observations
University of Toledo, Toledo, Ohio, USA - 5 observations
Main Street School, Norwalk, Ohio, USA – 43 observations
Martin Luther King Jr/Sr High School, Cleveland, Ohio, USA - 17 observations

Dr. C

Icicles and Watersheds: Part 1

Wednesday, January 9th, 2008

Why are the icicles so long on our house?

On a recent walk just a day or two after our first snow, my husband and I noticed that we had the longest icicles in the neighborhood. Some houses built the same time as our house had icicles, but they were shorter. One new house had almost no icicles.

But what was the most fun, was our own house. The picture below shows our “champion” icicles.

Sketch of icicles on the east side of our house

Figure 1. Sketch of icicles on the east side of our house. The windows to the right of the icicles are about 1 meter high. The part to the right is the front part of the house; the part to the left is the back part of the house.

Notice that the icicles only cover the middle third of the side of the house. To the right and to the left, there are no icicles. Were we to walk on the roof, we would probably find the snow melted in the middle third of the roof, but not on the sides.

Why? Our house was built in stages. The front two-thirds were built were built in 1950. There was little insulation in the roof. A few months before I made this sketch, we tore out the old ceiling in the room in the front of the house and found that the insulation from 1950 was in poor condition, just like the insulation in the middle of house. The new insulation was much better. The picture confirms that the new insulation was working. No icicles implies no water from melting snow. This means that little heat was escaping through the roof, so there was little or no snowmelt on the roof.

Similarly, the back part of the house was built in 1979. When that part of the house was built, we made sure we had good thick insulation in the roof. There are no icicles on the new part of the house. Again – the insulation must be working.

Using the data from our house, can we explain why our house had the longest icicles? I’m guessing that the new house in our neighborhood that had almost no icicles had good insulation – just like the newer parts of our house and the room we just insulated. We could that the snow on the roof of the new house was fairly deep – there was little melting.

What about the older houses with shorter icicles? Let’s imagine an older house with about the same insulation as the old parts of our house (Figure 2). If this is true, the snow would melt at about the same rate (I am assuming that the roof was exposed to the same amount of sunlight per unit area). Why then would the icicles be shorter on the other (imaginary) house?

If you believe my assumptions, the answer is that the area of the roof “draining” toward the eaves (where the icicles grow) was smaller. Say the distance from the top to the icicles on our imaginary house is 5 meters, and the distance on our house is 10 meters. As the melted snow moves down from the top of the roof to the eaves, twice as much water reaches a given length along the eaves for the 10-meter roof (ours) compared to the five-meter roof. It follows that the icicles on our house would contain twice as much water and be longer than on the other house. The icicles may be not twice as long, because the icicles we had might be wider as well as longer.

View of a slice of our house (top)

Figure 2. View of a one-meter slice of our house (top) and an imaginary neighborhood house (bottom). More water is available to flow over the eaves for our house. We are looking at the two houses from the north.

So the amount of water in the icicles is determined by the amount of snow upstream of (or straight up the roof from) the eaves.