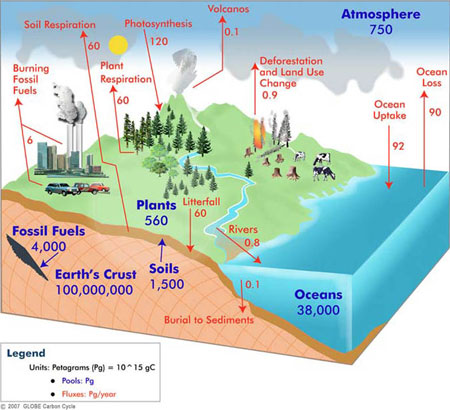
This blog was inspired by activities at the 2008 GLOBE Learning Expedition (GLE) in South Africa. As part of their field activities, the students visited the Global Atmosphere Watch station (GAWS) at Cape Point, where carbon dioxide and several other trace gases are measured from the top of a 30-m tower. The carbon dioxide record goes back to 1978, showing a rise comparable to that seen in the Northern Hemisphere.
Standing for much of two days with groups of students at the base of the weather tower at the GAWS site at Cape Point, I found myself wondering how much we were contributing to the carbon dioxide in the atmosphere. I returned home, resolving to estimate how much carbon dioxide an average human gives off in a given day simply by breathing.
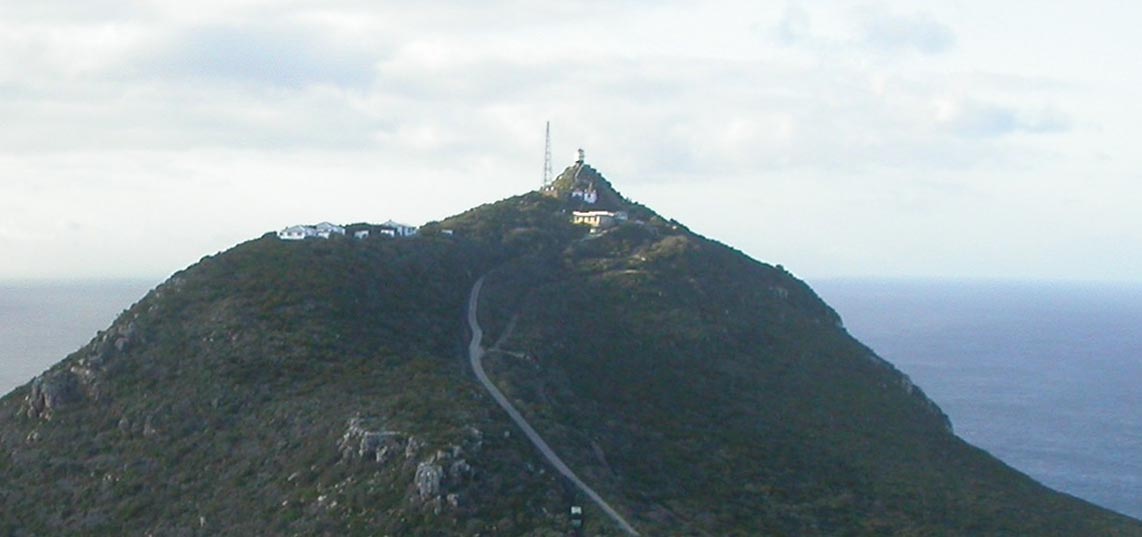
Figure 1a. 30-meter tall Global Atmosphere Watch Station (GAWS) tower from a distance. It is located almost at the southern tip of Africa.
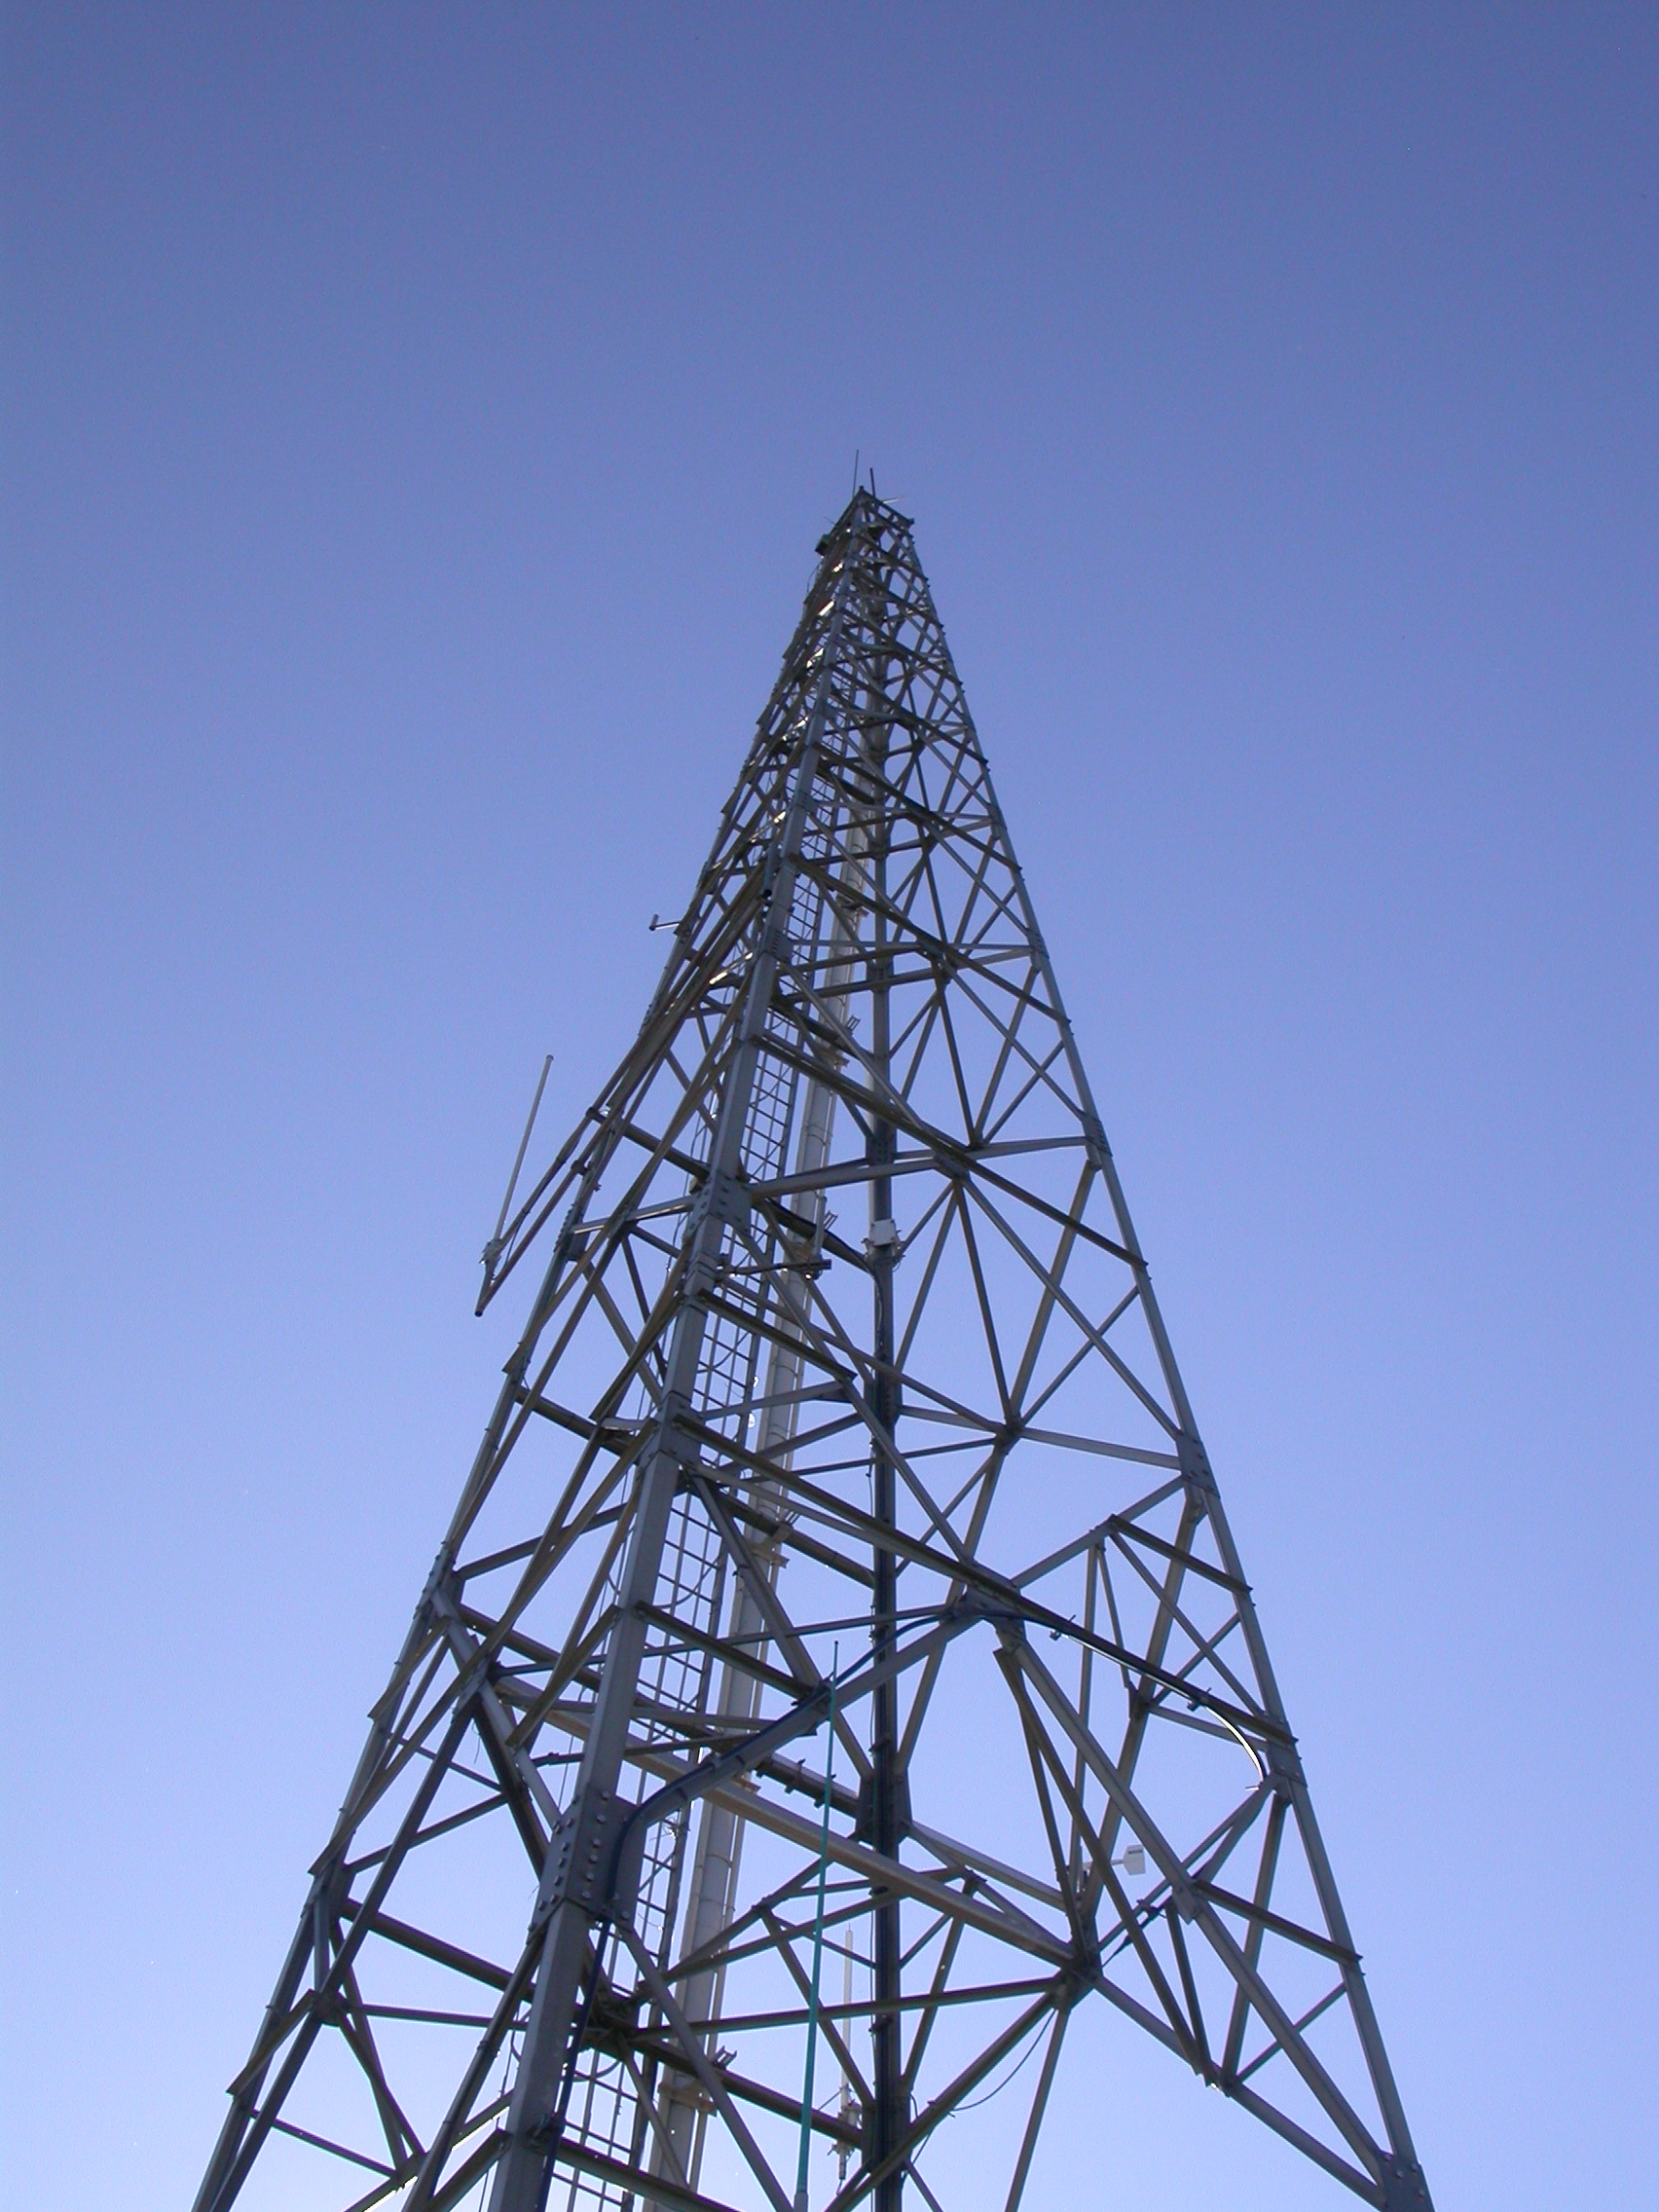
Figure 1b Close-up of GAWS tower. The air is pumped in from the top of the tower into the laboratory building, when it is analyzed for the fraction of carbon dioxide and other trace gases.
I will estimate this in two ways. First, based on how many Calories a “typical” human consumes. And secondly, based on how much carbon dioxide is released with each breath.
Based on how much we eat
I start with some rather gross assumptions:
- The average human eats 2000 Calories (kiloCalories) of food a day
- 100% of this food is processed, with all the carbon returning to the atmosphere
- All of the food eaten is in the form of sugars with carbon:hydrogen:oxygen ratios of 1:2:1.
And some information:
Atomic weight of carbon: 12
Atomic weight of hydrogen: 1
Atomic weight of oxygen: 16
Molecular weight of carbon dioxide (2 x 16 + 12 = 44)
This means that:
By mass, the sugars are 40% carbon
By mass, carbon dioxide is 27% carbon
Sugar provides 4 kiloCalories of energy per gram, meaning that our human eats 500 grams of sugar each day. 40% of this or 200 grams is carbon. Assuming all this carbon is released as part of carbon dioxide, our human releases 733 grams of carbon dioxide (200 grams x 44/12).
So, let’s just call our estimate 700 grams of carbon dioxide a day, recognizing that the number is an approximate one.
There are a number of reasons this is probably an overestimate. Our human wouldn’t eat all sugar. He/she would eat some fat as well, which has 9 kiloCalories per gram. We are assuming our human to be in steady state – so that net uptake by the body would be zero. But our human would release carbon in other forms (feces, dried skin, shed hair, etc.) So there would be some solid waste as well as gas – but over long term, there would be some carbon dioxide released from that.
Based on carbon dioxide released through breathing (respiration)
Let’s try another way to estimate the amount of carbon dioxide our human releases. But this time we focus on breathing. Again, some facts:
A human adult breathes 15 times a minute, on average (Reference 1). While I am writing this, my respiration rate is 16 breaths per minute, so this number seems reasonable. And, just for fun, I’ll use my respiration rate.
Each breath exchanges 500 cubic centimeters of air (Reference 2)
Assuming an air density of 1 kilogram per cubic meter, we can find out how many kilograms of air are exchanged for each breath:
500 cm x cm x cm x 0.01 m/cm x 0.01 m/cm x 0.01 m/cm
= 0.0005 cubic meters
0.0005 cubic meters x 1 kilogram per cubic meter
= 0.0005 kilograms of air per breath.
We now use this to estimate the kilograms of air processed each day, which is
0.0005 kilograms per breath x 16 breaths per minute x 1440 minutes per day
= 11.52 kilograms per day “processed” by breathing
To find out how much carbon dioxide is put into the atmosphere, we compare the amount of carbon dioxide (0.038% by volume) inhaled to the amount (4.6-5.9% by volume exhaled, Reference 3.), from the same web site. But first we need to allow that “by volume” means (using carbon dioxide as an example)
0.038 carbon dioxide molecules per 100 air molecules, or
3.8 carbon dioxide molecules per 10000 air molecules.
From above, we know that the molecular weight for carbon dioxide is about 44. The molecular weight for moist air is about 28, which means that the air we inhale contains about
3.8 x 44 divided by 28 x 10000 = or 0.0006 grams carbon dioxide per gram of air
The number “.0006″ is really a fraction – which I am labeling in grams per gram. It could just as easily be pound per pound.
Similarly, the fractional amount of carbon dioxide exhaled, by mass is, assuming 5% by volume:
0.05 x 44 divided by 28 x 100 or 0.0786
So the net fractional change in carbon dioxide for each breath is
0.0786 – 0.0006 or 0.0.078
Now we convert this to a mass by multiplying the fraction times the mass per breath, namely:
11.52 kilograms of air exchanged each day x 0.078 fractional increase in carbon dioxide,
= 0.9 kilograms of carbon dioxide for each day per human.
Again, we made assumptions to make things simple. Our human wasn’t exercising. Our human was an adult. And our human was exchanging a typical amount of air. Recognizing that the number is a crude estimate, I will again round the number to one significant figure, so that we have 0.9 kilograms of carbon dioxide released each day per human.
Isn’t it exciting that we came up with roughly the same answer! For comparison, Wickipedia (http://en.wikipedia.org/wiki/Breathing) quotes an estimate of 900 grams of carbon dioxide a day by the United States Department of Agriculture (USDA).
Here are some questions to think about:
The respiration rate I used was for an average adult. When I measured my respiration, I was sitting, so I’m thinking this is for an average adult at rest. How would these numbers be changed for someone who was exercising? Children breathe faster (Reference 3) but have smaller lungs. How would each of these factors affect the result? Finally, if you wanted a more accurate number, how would you change the calculations?
Comparison to carbon dioxide uptake by plants
How does that compare to some other things?
Prairie near Mandan, ND during the growing season (24 Apr – 26 October) 1996-1999, (reference 4)
1.85 grams CO2 per square meter taken from the atmosphere on average
(Meaning that 380 square meters of land would cancel out the effect of our human) – but remember – this in only during the growing season!
A generic tree (reference 5)
This tree (I’m assuming this is a big one) is said to take up 21.8 kilograms of carbon dioxide a year. For a year, our human produces about 365 x 0.7 kilograms a year, or 255 kilograms. So we’d need 10 of these threes to cancel the carbon dioxide we exhale. This site unfortunately does not quote a source.
Pine forest in Finland (Reference 6)
During the period of measurement, this forest took up
2.4 grams carbon dioxide per square meter per day during July/August, and
1.7 grams carbon dioxide per square meter per day during September
In “human units”, taking 0.7 kg/day, this means we’d need
290 square meters to offset our exhaled carbon dioxide in July and August, and 410 square meters to offset our exhaled carbon dioxide in September.
So – we are part of the carbon cycle, too! At Cape Point, we were breathing out carbon dioxide, but the atmosphere sampled was 30 meters above us – so we probably did not affect the measurements there. But I hear stories from scientists who are measuring carbon dioxide uptake about how they avoid contaminating their measurements. Some of the things they do – push their cars when they get close to the instruments instead of driving them, and leaving their dogs inside the car instead of letting them wander around the site. For more about the carbon cycle, visit the carbon cycle pages on the GLOBE web site.
References
1. p. 151, Berkow, , R., et al., 1997: The Merck Manuel for Medical Information: Home Edition. Merck & Co, publishers, 1509 pp.
2. p. 44, Kapit, W., et al., 1987: The Physiology Coloring Book. HarperCollins. 154 pp.
3. The five percent was decided on based on several references. The Argonne National Laboratory “Ask a Scientist” (http://www.newton.dep.anl.gov/askasci/zoo00/zoo00065.htm) lists 5.3 per cent by volume for “alveolar air” in response to a question about how much CO2 is exhaled. This is slightly lower than the range of values for arterial blood gases derived from p. 907, Taylor, C., C. Lillis, and P. LeMone, 1989: Fundamentals of Nursing. J. B. Lippincott Company, Philadelphia. 1356 pp. On the other hand, http://en.wikipedia.org/wiki/Breath writes exhaled air has 4-5% carbon dioxide by volume, with the BBC listing 4%.
4. Frank, A.B., and A. Dugas, 2001: Carbon dioxide fluxes over a northern, semiarid. mixed-grass prairie. Agricultural and Forest Meteorology. 108, 317-326,
5. http://www.coloradotrees.org/benefits.htm#10
6. U. Rannik et al, 2002 fluxes of carbon dioxide and water vapour over Scots pine forest and clearing. Agricultural and Forest Meteorology, 111, 187-202
Acknowledgments. I talked about this blog a great deal with colleagues. I am indebted to Jimy Dudhia and Greg Holland for contributing useful ideas and information. Also, our sincere thanks to the staff at the Cape Point GAWS station for sharing their facility with the students at the GLE.