Chronological List of U.S. Billion Dollar Events Chronological List of U.S. Billion Dollar Events
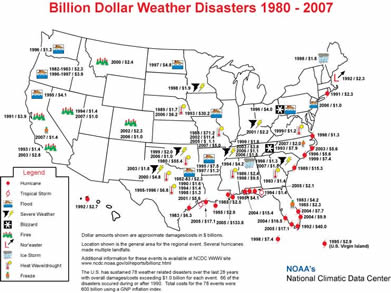
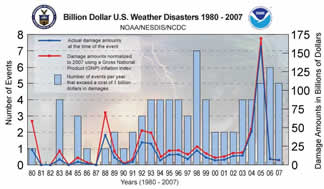
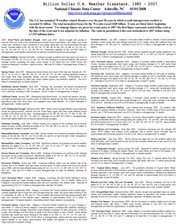
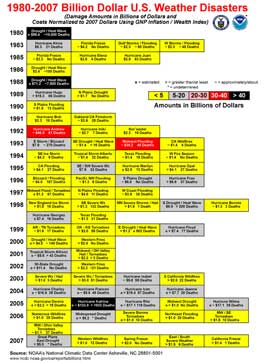
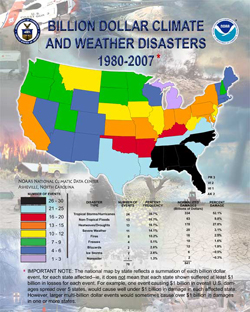
The U.S. has sustained 78 weather-related disasters over the past 28 years in which overall damages/costs reached or exceeded $1 billion. The total normalized losses for the 78 events exceed $600 billion. Events are listed below beginning with the most recent. Two damage figures are given for events prior to 2007-the first figure represents actual dollar costs at the time of the event and is not adjusted for inflation. The value in parenthesis is the costs normalized to 2007 dollars using a GNP inflation index.
These statistics were taken from a wide variety of sources and represent, to the best of our ability, the estimated total costs of these events---that is, the costs in terms of dollars and lives that would not have been incurred had the event not taken place. Insured and uninsured losses are included in damage estimates, and direct plus indirect deaths (i.e., closely related to the event, would not have occurred otherwise) are included in fatality totals. Economic costs are included for wide-scale, long-lasting events such as drought.
Estimates are periodically updated as more data/information become available. Sources include Storm Data (NCDC publication), the National Weather Service, the Federal Emergency Management Agency, other U.S. government agencies, individual state emergency management agencies, state and regional climate centers, and insurance industry estimates.
NOTE: In some cases, the "special reports" provided via html links below include preliminary damage and fatality statistics, which are now updated in the chronological listing below with our final figures. Therefore, we will always attempt to have our final compilation of damages and fatalities in the billion dollar weather disasters report.
---- 2007 ----
Great Plains and Eastern Drought Entire year 2007. Severe drought with periods of extreme heat over most of the southeast and portions of the Great Plains, Ohio Valley, and Great Lakes area, resulting in major reductions in crop yields, along with very low stream-flows and lake levels. Includes states of ND, SD, NE, KS, OK, TX, MN, WI, IA, MO, AR, LA, MS, AL, GA, NC, SC, FL, TN, VA, WV, KY, IN, IL, OH, MI, PA, NY. Preliminary estimate of well over $5.0 billion in damage/costs; some deaths reported due to heat but not beyond typical annual averages. Special Report
Western Wildfires Summer-Fall 2007. Continued drought conditions and high winds over much of the western US (AK, AZ, CA, ID, UT, MT, NV, OR, WA) resulting in numerous wildfires; with national acreage burned exceeding 8.9 million acres (mainly in the west) and over 3,000 homes and structures destroyed in southern California alone. Well over $1.0 billion in damages/costs; at least 12 deaths. Special Report
Spring Freeze April 2007. Widespread severe freeze over much of the east and midwest (AL, AR, GA, IL, IN, IA, KS, KY, MS, MO, NE, NC, OH, OK, SC, TN, VA, WV), causing significant losses in fruit crops, field crops (especially wheat), and the ornamental industry. Temperatures in the teens/20's accompanied by rather high winds nullified typical crop-protection systems. Over $2.0 billion in damage/costs; no deaths reported. Special Report
East/South Severe Weather April 2007. Flooding, hail, tornadoes, and severe thunderstorms across numerous states (CT, DE, GA, LA, ME, MD, MA, MS, NH, NJ, NY, NC, PA, RI, SC, TX, VT, VA) in mid-April, including 3 "killer" tornadoes. Over $1.5 billion in damages/costs; 9 deaths. Special Report
California Freeze January 2007. Widespread agricultural freeze - for nearly two weeks in January, overnight temperatures over a good portion of California dipped into the 20's, destroying numerous agricultural crops; with citrus, berry, and vegetable crops most affected. $1.4 billion estimated in damage/costs; 1 fatality reported. Special Report
---- 2006 ----
Numerous Wildfires Entire year 2006. Numerous wildfires mainly over the western half of the country due to dry weather and high winds, burning nearly 10 million acres (new record for period since 1960), with the most affected states being AK, AZ, CA, CO, FL, ID, MT, NM, NV, OK, OR, TX, WA, WY. Well over $1.0 billion in overall damages/costs; at least 28 fatalities, including 20 firefighters. Special Reports
Widespread Drought Spring-Summer 2006. Rather severe drought affected crops
especially during the spring-summer, centered over the Great Plains region with other
areas affected across portions of the south and far west- including states of ND, SD,
NE, KS, OK, TX, MN, IA, MO, AR, LA, MS, AL, GA, FL, MT, WY, CO, NM, CA. Estimate of over $6.0 (6.2) billion damages/costs; some heat-related deaths but not beyond typical annual averages. Special Report
Northeast Flooding June 2006. Severe flooding over portions of the northeast due to several weeks of heavy rainfall, affecting the states of NY, PA, DE, MD, NJ, and VA. Over $1.0 billion in damage/costs; at least 20 deaths reported. Special Report
Midwest/Southeast Tornadoes April 2006. Severe weather and numerous tornadoes affecting the states of OK, KS, MO, NE, KY, OH, TN, IN, MS, GA, and AL on April 6-8 with 3 "killer" tornadoes in TN. Over $1.5 billion in damages/costs; 10 deaths. Special Report
Midwest/Ohio Valley Tornadoes April 2006. Significant outbreak of tornadoes and severe weather affecting the states of IL, IN, IA, AR, MO, KY, and TN on April 2nd with 5 "killer" tornadoes. Approximately $1.1 billion in damages/costs; 27 deaths. Special Report
Severe Storms and Tornadoes March 2006. Outbreak of tornadoes over portions of the midwest and south during a week-long period-affecting the states of AL, AR, KY, MS, TN, TX, IN, KS, MO, and OK. Over $1.0 billion in damage/costs; at least 10 deaths. Special Reports
---- 2005 ----
Hurricane Wilma October 2005. Category 3 hurricane hits SW Florida resulting in strong damaging winds and major flooding across southeastern Florida. Prior to landfall, Wilma as a Category 5 recorded the lowest pressure (882 mb) ever recorded in the Atlantic basin. Estimate of approximately $16.0 (17.1) billion in damages/costs; estimated 35 deaths.
GLIDE number TC-2005-000178-BHS and TC-2005-000178-MEX.
Special Report
Hurricane Rita September 2005. Category 3 hurricane hits Texas-Louisiana border coastal region, creating significant storm surge and wind damage along the coast, and some inland flooding in the FL panhandle, AL, MS, LA, AR, and TX. Prior to landfall, Rita reached the third lowest pressure (897 mb) ever recorded in the Atlantic basin. Estimate of approximately $16.0 (17.1) billion in damage/costs; 119 deaths reported-most being indirect (many related to evacuations).
GLIDE number TC-2005-000163-CUB.
Special Report
Hurricane Katrina August 2005. Category 3 hurricane initially impacts the U.S. as a Category 1 near Miami, FL, then as a strong Category 3 along the eastern LA-western MS coastlines, resulting in severe storm surge damage (maximum surge probably exceeded 25 feet) along the LA-MS-AL coasts, wind damage, and the failure of parts of the levee system in New Orleans. Inland effects included high winds and some flooding in the states of AL, MS, FL, TN, KY, IN, OH, and GA. Estimate of approximately $125 (133.8) billion in damage/costs, making this the most expensive natural disaster in U.S. history; approximately 1833 deaths-the highest U.S. total since the 1928 major hurricane in southern Florida.
GLIDE number TC-2005-000144-USA.
5 MB File - Special Report
Hurricane Dennis July 2005. Category 3 hurricane makes landfall in western Florida panhandle resulting in storm surge and wind damage along the FL-AL coasts, along with scattered wind and flood damage in GA, MS, and TN. Estimate of over $2.0 (2.1) billion in damage/costs; at least 15 deaths.
GLIDE number TC-2005-000112-JAM.
Special Report
Midwest Drought Spring-Summer 2005. Rather severe localized drought causes significant crop losses (especially for corn and soybeans) in the states of AR, IL, IN, MO, OH, and WI. Estimate of over $1.0 (1.1) billion in damage/costs; no reported deaths.
Special Report
---- 2004 ----
Hurricane Jeanne September 2004. Category 3 hurricane makes landfall in east-central Florida, causing considerable wind, storm surge, and flooding damage in FL, with some flood damage also in the states of GA, SC, NC, VA, MD, DE, NJ, PA, and NY. Puerto Rico also affected. Estimate of over $7.0 (7.7) billion in damage/costs; at least 28 deaths.
GLIDE number TC-2004-000098-BHS and TC-2004-000098-HTI.
Special Report
Hurricane Ivan September 2004. Category 3 hurricane makes landfall on Gulf coast of Alabama, with significant wind, storm surge, and flooding damage in coastal AL and FL panhandle, along with wind/flood damage in the states of GA, MS, LA, SC, NC, VA, WV, MD, TN, KY, OH, DE, NJ, PA, and NY. Estimate of over $14.0 (15.4) billion in damage/costs; at least 57 deaths.
GLIDE number TC-2004-000089-USA and TC-2004-000089-BRB.
Special Report
Hurricane Frances September 2004. Category 2 hurricane makes landfall in east-central Florida, causing significant wind, storm surge, and flooding damage in FL, along with considerable flood damage in the states of GA, SC, NC, and NY due to 5-15 inch rains. Estimate of over $9.0 (9.9) billion in damage/costs; at least 48 deaths.
Special Report
Hurricane Charley August 2004. Category 4 hurricane makes landfall in southwest Florida, resulting in major wind and some storm surge damage in FL, along with some damage in the states of SC and NC. Estimate of over $15.0 (16.5) billion in damage/costs; at least 35 deaths.
GLIDE number TC-2004-000073-USA and TC-2004-000073-JAM.
Special Report
---- 2003 ----
Southern California Wildfires Late October-early November 2003. Dry weather, high winds, and resulting wildfires in Southern California. More than 743,000 acres of brush and timber burned, over 3,700 homes destroyed; over $2.5 (2.8) billion in damage/costs; 22 deaths. October Special Report and November Special Report
Hurricane Isabel September 2003. Category 2 hurricane makes landfall in eastern North Carolina, causing considerable storm surge damage along the coasts of NC, VA, and MD, with wind damage and some flooding due to 4-12 inch rains in NC, VA, MD, DE, WV, NJ, NY, and PA; approximately $5.0 (5.6) billion in damage/costs; 55 deaths. Special
Report
Severe Storms and Tornadoes Early May 2003. Numerous tornadoes
over the midwest, MS valley, OH/TN valleys and portions of the
southeast, with a modern record one-week total of approximately 400
tornadoes reported; over $3.4 billion in damages/costs; 51 deaths. Special Report
Storms and Hail Early April 2003. Severe storms and large hail
over the southern plains and lower MS valley, with Texas hardest hit,
and much of the monetary losses due to hail; over $ 1.6 billion in
damages/costs: 3 deaths. Special Report
---- 2002 ----
Widespread Drought Spring through early Fall 2002. Moderate to
Extreme drought over large portions of 30 states, including the western
states, the Great Plains, and much of the eastern U.S.; estimate of
over $ 10.0 billion (11.4)in damages/costs; no deaths. Special Report
Western Fire Season Spring through Fall 2002. Major fires over
11 western states from the Rockies to the west coast, due to drought
and periodic high winds, with over 7.1 million acres burned; over $ 2.0
(2.3) billion in damages/costs; 21 deaths.
Special Report
---- 2001 ----
Tropical Storm Allison June 2001. The persistent remnants of
Tropical Storm Allison produces rainfall amounts of 30-40 inches in
portions of coastal Texas and Louisiana, causing severe flooding
especially in the Houston area, then moves slowly northeastward;
fatalities and significant damage reported in TX, LA, MS, FL, VA, and
PA; estimate of approximately $5.0 (5.6) billion in damage/costs; at
least 43 deaths. Special Report
Midwest and Ohio Valley Hail and Tornadoes April 2001. Storms,
tornadoes, and hail in the states of TX, OK, KS, NE, IA, MO, IL, IN,
WI, MI, OH, KY, WV, and PA, over a 6-day period; over $1.9 (2.2) billion in
damage/costs, with the most significant losses due to hail; at least 3
deaths.
---- 2000 ----
Drought/Heat Wave Spring-Summer 2000. Severe drought and
persistent heat over south-central and southeastern states causing
significant losses to agriculture and related industries; estimate of
over $4.0 (4.8) billion in damage/costs; estimated 140 deaths
nationwide. Special Report
Western Fire Season Spring-Summer 2000. Severe fire season in
western states due to drought and frequent winds, with nearly 7 million
acres burned; estimate of over $2.0 (2.4) billion in damage/costs
(includes fire suppression); no deaths reported. Special Report
---- 1999 ----
Hurricane Floyd September 1999. Large category 2 hurricane makes
landfall in eastern NC, causing 10-20 inch rains in 2 days, with severe
flooding in NC and some flooding in SC, VA, MD, PA, NY, NJ, DE, RI, CT,
MA, NH, and VT; estimate of at least $6.0 (7.4) billion damage/costs;
77 deaths. Special Report
Eastern Drought/Heat Wave Summer 1999. Very dry summer and high
temperatures, mainly in eastern U.S., with extensive agricultural
losses; over $1.0 (1.2) billion damage/costs; estimated 502 deaths. Special Report
Oklahoma-Kansas Tornadoes May 1999. Outbreak of F4-F5 tornadoes
hit the states of Oklahoma and Kansas, along with Texas and Tennessee,
Oklahoma City area hardest hit; over $1.6 (2.0) billion damage/costs;
55 deaths. Special Report
Arkansas-Tennessee Tornadoes January 1999. Two outbreaks of
tornadoes in 6-day period strike Arkansas and Tennessee; approximately
$1.3 (1.6) billion damage/costs; 17 deaths. Special Report
---- 1998 ----
Texas Flooding October-November 1998. Severe flooding in
southeast Texas from 2 heavy rain events, with 10-20 inch rainfall
totals; approximately $1.0 (1.3) billion damage/costs; 31 deaths.
Hurricane Georges September 1998. Category 2 hurricane strikes
Puerto Rico, Florida Keys, and Gulf coasts of Louisiana, Mississippi,
Alabama, and Florida panhandle, 15-30 inch 2-day rain totals in parts
of AL/FL; estimated $5.9 (7.4) billion damage/costs; 16 deaths. Special Report
Hurricane Bonnie August 1998. Category 3 hurricane strikes
eastern North Carolina and Virginia, extensive agricultural damage due
to winds and flooding, with 10-inch rains in 2 days in some locations;
approximately $1.0 (1.3) billion damage/costs; 3 deaths. Special Report
Southern Drought/Heat Wave Summer 1998. Severe drought and heat
wave from Texas/Oklahoma eastward to the Carolinas; $6.0-$9.0 billion
(7.6-11.3) damage/costs to agriculture and ranching; at least 200
deaths. Special Report
Minnesota Severe Storms/Hail May 1998. Very damaging severe
thunderstorms with large hail over wide areas of Minnesota; over $1.5
(1.9) billion damage/costs; 1 death.
Southeast Severe Weather Winter-Spring 1998. Tornadoes and
flooding related to El Nino in southeastern states; over $1.0 (1.3)
billion damage/costs; at least 132 deaths. Special Report
Northeast Ice Storm January 1998. Intense ice storm hits Maine,
New Hampshire, Vermont, and New York, with extensive forestry losses;
over $1.4 (1.8) billion damage/costs; 16 deaths. Special Report
---- 1997 ----
Northern Plains Flooding April-May 1997. Severe flooding in
Dakotas and Minnesota due to heavy spring snowmelt; approximately $3.7
(4.8) billion damage/costs; 11 deaths. Special Report
MS and OH Valleys Flooding and Tornadoes March 1997. Tornadoes
and severe flooding hit the states of AR, MO, MS, TN, IL, IN, KY, OH,
and WV, with over 10 inches in 24 hours in Louisville; estimated $1.0
(1.3) billion damage/costs; 67 deaths.
Special Report
West Coast Flooding December 1996-January 1997. Torrential rains
(10-40 inches in 2 weeks) and snowmelt produce severe flooding over
portions of California, Washington, Oregon, Idaho, Nevada, and Montana;
approximately $3.0 (3.9) billion damage/costs; 36 deaths. Special Report
---- 1996 ----
Hurricane Fran September 1996. Category 3 hurricane strikes North Carolina and Virginia, over 10-inch 24-hour rains in some locations and extensive agricultural and other losses; over $5.0 (6.6) billion in damage/costs; 37 deaths. Special Report
Southern Plains Severe Drought Fall 1995 through Summer 1996.
Severe drought in agricultural regions of southern plains--Texas and
Oklahoma most severely affected; approximately $5.0 (6.8) billion
damage/costs; no deaths.
Pacific Northwest Severe Flooding February 1996. Very heavy,
persistent rains (10-30 inches) and melting snow over Oregon,
Washington, Idaho, and western Montana; approximately $1.0 (1.3)
billion damage/costs; 9 deaths. Special Report
Blizzard of '96 Followed by Flooding January 1996. Very heavy
snowstorm (1-4 feet) over Appalachians, Mid-Atlantic, and Northeast;
followed by severe flooding in parts of same area due to rain and
snowmelt; approximately $3.0 (4.0) billion damage/costs; 187 deaths. Special Report
---- 1995 ----
Hurricane Opal October 1995. Category 3 hurricane strikes
Florida panhandle, Alabama, western Georgia, eastern Tennessee, and the
western Carolinas, causing storm surge, wind, and flooding damage; over
$3.0 (4.1) billion damage/costs; 27 deaths. Special Report
Hurricane Marilyn September 1995. Category 2 hurricane devastates U.S. Virgin Islands; estimated $2.1 (2.9) billion damage/costs; 13 deaths.
Texas/Oklahoma/Louisiana/Mississippi Severe Weather and Flooding
May 1995. Torrential rains, hail, and tornadoes across Texas - Oklahoma
and southeast Louisiana - southern Mississippi, with Dallas and New
Orleans areas (10-25 inches in 5 days) hardest hit; $5.0-$6.0 (6.8-8.2)
billion damage/costs; 32 deaths.
California Flooding January-March 1995. Frequent winter storms
cause 20-70 inches rainfall and periodic flooding across much of
California; over $3.0 (4.1) billion damage/costs; 27 deaths. Special Report
---- 1994 ----
Western Fire Season Summer-Fall 1994. Severe fire season in
western states due to dry weather; approximately $1.0 (1.4) billion
damage/costs; death toll undetermined.
Texas Flooding October 1994. Torrential rain (10-25 inches in 5
days) and thunderstorms cause flooding across much of southeast Texas;
approximately $1.0 (1.4) billion damage/costs; 19 deaths.
Tropical Storm Alberto July 1994. Remnants of slow-moving
Alberto brought torrential 10-25 inch rains in 3 days, widespread
flooding, and agricultural damage in parts of Georgia, Alabama, and
panhandle of Florida; approximately $1.0 (1.4) billion damage/costs; 32
deaths. Special Report
Southeast Ice Storm February 1994. Intense ice storm with
extensive damage in portions of TX, OK, AR, LA, MS, AL, TN, GA, SC, NC,
and VA; approximately $3.0 (4.2) billion damage/costs; 9 deaths. Special Report and Special Report #2
---- 1993 ----
California Wildfires Fall 1993. Dry weather, high winds, and
wildfires in southern California; approximately $1.0 (1.4) billion
damage/costs; 4 deaths.
Midwest Flooding Summer 1993. Severe, widespread flooding in central U.S. due to persistent heavy rains
and thunderstorms; approximately $21.0 (30.2) billion damage/costs; 48 deaths. Special Report and Special Report #2
Drought/Heat Wave Summer 1993. Southeastern U.S.; about $1.0 (1.4) billion damage/costs to agriculture;
at least 16 deaths. Special Report and Special Report #2
Storm/Blizzard March 1993. "Storm of the Century" hits entire
eastern seaboard with tornadoes, high winds, and heavy snows (2-4
feet); $5.0-$6.0 (7.2-8.6) billion damage/costs; approximately 270
deaths. Special Report and Special Report #2
---- 1992 ----
Nor'easter of 1992 December 1992. Slow-moving storm batters
northeast U.S. coast, New England hardest hit; $1.0-$2.0 (1.5-3.0)
billion damage/costs; 19 deaths.
Hurricane Iniki September 1992. Category 4 hurricane hits Hawaiian island of Kauai; about $1.8 (2.7) billion damage/costs; 7 deaths.
Hurricane Andrew August 1992. Category 5 hurricane hits Florida
and Louisiana, high winds damage or destroy over 125,000 homes;
approximately $27.0 (40.0) billion damage/costs; 61 deaths.
Special Report
---- 1991 ----
Oakland Firestorm October 1991. Oakland, California firestorm
due to low humidities and high winds; approximately $2.5 (3.9) billion
damage/costs; 25 deaths.
Hurricane Bob August 1991. Category 2 hurricane--Mainly coastal
North Carolina, Long Island, and New England; $1.5 (2.3) billion
damage/costs; 18 deaths.
---- 1990 ----
Texas/Oklahoma/Louisiana/Arkansas Flooding May 1990. Torrential
rains cause flooding along the Trinity, Red, and Arkansas Rivers in TX,
OK, LA, and AR; over $1.0 (1.6) billion damage/costs; 13 deaths.
---- 1989 ----
Hurricane Hugo September 1989. Category 4 hurricane devastates
South and North Carolina with ~ 20-foot storm surge and severe wind
damage after hitting Puerto Rico and the U.S. Virgin Islands; over $9.0
(15.3) billion damage/costs (about $7.1 (12.1) billion in Carolinas);
86 deaths (57--U.S. mainland, 29--U.S. Islands).
Northern Plains Drought Summer 1989. Severe summer drought over
much of the northern plains with significant losses to agriculture; at
least $1.0 (1.7) billion in damage/costs; no deaths reported.
---- 1988 ----
Drought/Heat Wave Summer 1988. 1988 drought in central and
eastern U.S. with very severe losses to agriculture and related
industries; estimated $40.0 (71.2) billion damage/costs; estimated
5,000 to 10,000 deaths (includes heat stress-related).
---- 1986 ----
Southeast Drought/Heat Wave Summer 1986. Severe summer drought
in parts of the southeastern U.S. with severe losses to agriculture;
$1.0-$1.5 (1.9-2.8) billion in damage/costs; estimated 100 deaths.
---- 1985 ----
Hurricane Juan October-November 1985. Category 1
hurricane--Louisiana and Southeast U.S.--severe flooding; $1.5 (2.9)
billion damage/costs; 63 deaths.
Hurricane Elena August-September 1985. Category 3 hurricane--Florida to Louisiana; $1.3 (2.5) billion damage/costs; 4 deaths.
Florida Freeze January 1985. Severe freeze central/northern Florida; about $1.2 (2.3) billion damage to citrus industry; no deaths.
---- 1983 ----
Florida Freeze December 1983. Severe freeze central/northern Florida; about $2.0 (4.2) billion damage to citrus industry; no deaths.
Hurricane Alicia August 1983. Category 3 hurricane--Texas; $3.0 (6.3) billion damage/costs; 21 deaths.
Western Storms and Flooding 1982 - Early 1983. Storms and
flooding related to El Nino, especially in the states of WA, OR, CA,
AZ, NV, ID, UT, and MT; approximately $1.1 (2.3) billion in
damage/costs; at least 45 deaths.
Gulf States Storms and Flooding 1982 - Early 1983. Storms and
flooding related to El Nino, especially in the states of TX, AR, LA,
MS, AL, GA, and FL; approximately $1.1 (2.3) billion in damage/costs;
at least 50 deaths.
---- 1980 ----
Drought/Heat Wave June-September 1980. Central and eastern U.S.;
estimated $20.0 (55.4) billion damage/costs to agriculture and related
industries; estimated 10,000 deaths (includes heat stress-related).
Top of Page
|