 Drought & Heat | Flooding | Storms | Tropical Cyclones | Extratropical Cyclones | Severe Winter Weather

| Throughout much of the western United States, severe to extreme drought was widespread. The most concentrated areas of extreme to exceptional drought classification were across the Northern Rockies. |
larger image
|
Additional information regarding drought conditions across the United States can be found in the October drought report.
 larger image
|
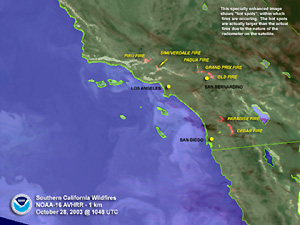
Very dry conditions along with Santa Ana winds created a deadly wildfire emergency across southern California by late in the month. More than 13,000 firefighters fought blazes across San Diego, Los Angeles, San Bernadino and Ventura counties (CNN). |
| As of October 30, the fires had destroyed at least 2,400 homes, charred more than 475,000 acres (190,000 hectares) and killed 20 people (CNN). The California governor's office estimated that fire damage was approaching $2 billion (USD). The Cedar Fire, located in San Diego county, grew to a size of 250,000 acres (101,000 hectares) by the 29th, making it the largest brush fire in the state since 1932 (California Dept of Forestry). |
larger image
|
larger image
|
Long-term drought continued across much of the Greater Horn of Africa in October, where September 2003 precipitation was around half of normal across parts of Ethiopia.
|
Across Tanzania, drought caused livestock prices to tumble while maize prices rose steadily since August 2003. Food shortages have been caused by below normal rainfall during the 2002/2003 agricultural season (WFP).
For the latest weekly weather impacts summary and forecast, see the Africa Weather Hazards Assessment from the Climate Prediction Center.


| A storm system aided by a powerful Pacific jet stream brought heavy rains and flooding to areas of Washington and British Columbia during mid October. Numerous daily rainfall records were broken across western Washington on October 20-21. The 21st was the wettest day in Seattle weather history (since 1891), with 128 mm / 5.02 inches. Washington governor Gary Locke declared a state of emergency for 7 counties as 10 rivers in the state went above the flood stage. In British Columbia, rainfall was described as the heaviest in 100 years, with around 500 mm (16 inches) of rain in the Pemberton and Squamish region. Flooding displaced hundreds of people and resulted in 2 deaths in British Columbia (AFP). |
larger image
|
 larger image
|
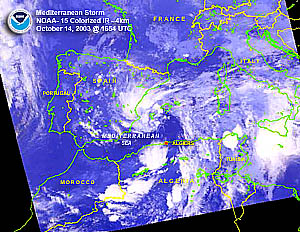
Showers and thunderstorms brought flooding to Algiers, the capital of Algeria during the 14-17th. At least thirteen people were swept away and killed by flood waters, with most of the fatalities occurring in the cities of Saida and Assa (AFP/Reuters). |
In Haiti, heavy rains during the 5th-6th in the capital city of Port-au-Prince triggered landslides that collapsed homes in four neighborhoods. The flooding was responsible for at least 13 deaths (Reuters)
In northern China, flooding along the Yellow and Wei Rivers forced the evacuation of 238,000 people in the northern province of Shaanxi. In east China's Shandong province, dike breaks along the Yellow River forced 11,000 people to be relocated (AFP). Flooding was also observed in Henan province, with a combined death toll of 36 people in Henan and Shaanxi provinces by mid-month (AFP).
Flooding in Malaysia's northern states on the 6th displaced 25,000 people from their homes and resulted in 2 deaths. In Sumatra, Indonesia, a landslide following heavy rain killed 5 people on the 4th (Disasterrelief.org).
In Vietnam, flooding and landslides in the central part of the country claimed 44 lives (AFP). Tens of thousands of homes were submerged and thousands of hectares of crops washed away from flooding that affected Binh Dinh and Quang Nam provinces during October 14-21.
For an archive of flood events worldwide, see the  Dartmouth Flood Observatory. Dartmouth Flood Observatory.

| Severe thunderstorms accompanying a strong cold front produced scattered wind damage in areas of the U.S. Mid-Atlantic region on the 14th. |
larger image
|

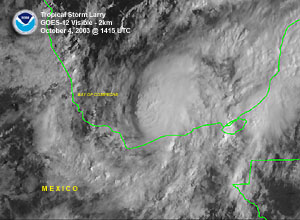
| Tropical Storm Larry developed in the southern Gulf of Mexico on the 1st and trekked slowly southward into the Bay of Campeche, making landfall just east of Coatzacoalcos, Mexico on the 5th with maximum sustained winds near 85 km/hr (45 knots or 50 mph). Larry brought heavy rain to areas of Tabasco and Veracruz states, and prompted the temporary closure of two oil export ports of Dos Bocas and Pajaritos (Reuters). |
larger image
|
 larger image
|
Hurricane Olaf formed as a tropical depression on the 3rd in the eastern Pacific Ocean south of Acapulco, Mexico. Olaf peaked with maximum sustained winds near 120 km/hr (65 knots or 75 mph) before weakening prior to landfall. Olaf crossed into Mexico near Manzanillo as a 95 km/hr (50 knots or 60 mph) tropical storm on the 7th.
|
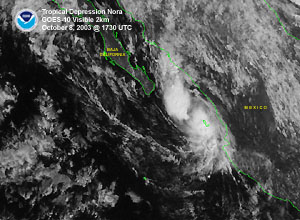
| Hurricane Nora developed as a tropical depression in the eastern Pacific Ocean on the 1st. Nora reached maximum intensity over open waters on the 4th with maximum sustained winds near 165 km/hr (90 knots or 100 mph). Nora weakened to a depression before moving inland early on the 9th near Mazatlan, Mexico. |
larger image
|
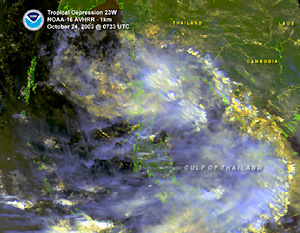
| Tropical Cyclone 23W developed in the Gulf of Thailand on the 23rd and crossed the Malay Peninsula on the 24th as a tropical depression. The cyclone brought train traffic and other transportation to a halt and forced the evacuation of more than 700 people across southern Thailand. Thousands of people were affected by torrential rains, and two fishing vessels were capsized in the Gulf of Thailand on the 22nd as the storm was in its developmental stages. The cyclone moved westward and crossed the Bay of Bengal, making landfall in eastern India on the 28th. |
larger image
|

 larger image
|
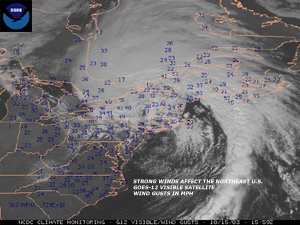
A strong low pressure system brought showers, thunderstorms and strong winds to much of the Northeast and Mid-Atlantic region of the United States on October 15. In Maine, gusty winds knocked down trees and power lines which left about 110,000 homes and businesses without power. Farther south, thousands of residents in Massachusetts, New Jersey and Pennsylvania also lost electricity. Wind gusts of 80-115 km/hr (50-70 mph) were reported in parts of the area. (Associated Press).
|

| Heavy snowfall affected the west coast of Finland during October 19-20. Across the southern and western parts of the country, temperatures fell to -9°C (16°F). According to statistics from the Finnish Meterological Institute, October temperatures fall this low only 5 times every 100 years (Helsingin Sanomat). |
Click for Animation
|
 larger image
|
A cold outbreak across parts of Europe brought record cold temperatures to parts of southern Germany on the 25th. Temperatures in the Bavarian town of Oberstdorf fell to -12°C (10°F), or the coldest October temperature since 1936. Snowfall in parts of the Bavarian region accumulated to 20 cm (8 inches) (AFP).
|
References:
Basist, A., N.C. Grody, T.C. Peterson and C.N. Williams, 1998: Using the Special Sensor Microwave/Imager to Monitor Land Surface Temperatures, Wetness, and Snow Cover. Journal of Applied Meteorology, 37, 888-911.
Peterson, Thomas C. and Russell S. Vose, 1997: An overview of the Global Historical Climatology Network temperature data base. Bulletin of the American Meteorological Society, 78, 2837-2849.
For all climate questions other than questions concerning this report, please contact the National Climatic Data Center's Climate Services Division:
Climate Services Division
NOAA/National Climatic Data Center
151 Patton Avenue, Room 120
Asheville, NC 28801-5001
fax: 828-271-4876
phone: 828-271-4800
email: ncdc.orders@noaa.gov
For more information, refer also to ...
September 2003 Hazards
and Significant Events
Selected U.S. City and State Extremes
2003 Atlantic Hurricanes
2003 East Pacific Hurricanes
2003 U.S. Wildfire Summary
SSMI Derived Products
Global Historical Climatology Network (GHCN)
The Blended GHCN - SSM/I Product
The Global Temperature Anomalies
CLIMVIS - Global Summary of the Day
CAMS data provided by the Climate Prediction Center
Tropical Rainfall Measuring Mission (TRMM) - NASA
Geographic Reference Maps (pdf format)
For further information on the historical climate perspective presented in this report, contact:
Scott Stephens
NOAA/National Climatic Data Center
151 Patton Avenue
Asheville, NC 28801-5001
fax: 828-271-4328
email: Scott.Stephens@noaa.gov
-or-
Jay Lawrimore
NOAA/National Climatic Data Center
151 Patton Avenue
Asheville, NC 28801-5001
fax: 828-271-4328
email: Jay.Lawrimore@noaa.gov
 NCDC / Climate
Monitoring / Climate
of 2003 / Hazards / Search / Help NCDC / Climate
Monitoring / Climate
of 2003 / Hazards / Search / Help
http://www.ncdc.noaa.gov/oa/climate/research/2003/oct/hazards.html
Downloaded Saturday, 20-Sep-2008 11:30:39 EDT
Last Updated Friday, 18-Nov-2005 14:12:17 EST by Scott.Stephens@noaa.gov
Please see the NCDC Contact Page if you have questions or comments.
|


 Smoke From California Wildfires


