Texas-Mexico Tornado
|
Global Hazards And Significant Events
April 2007
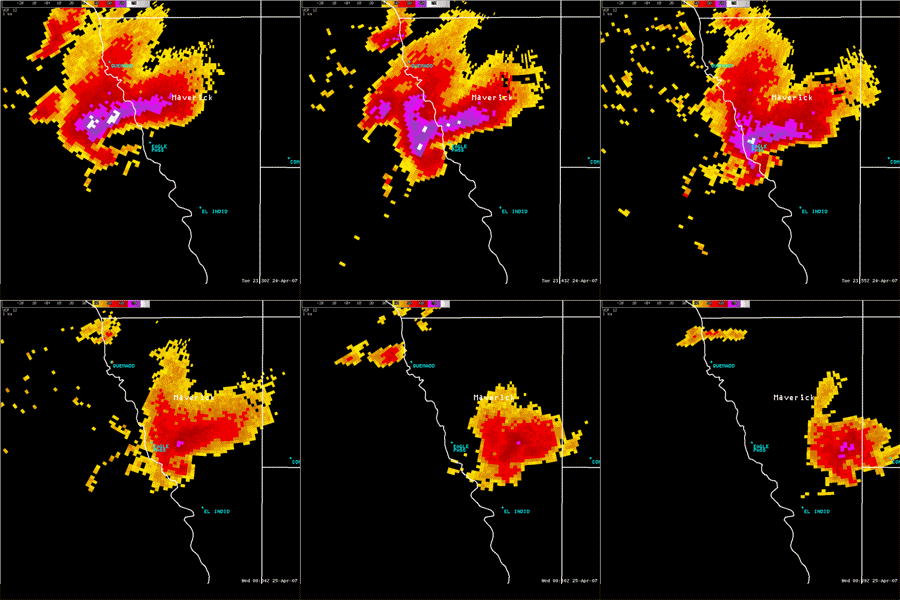
A severe thunderstorm produced a devastating tornado that affected the Texas-Mexico border on the night of April 24. Additional information can be found below.
|
 Drought & Heat | Flooding | Storms | Tropical Cyclones | Extratropical Cyclones | Severe Winter Weather


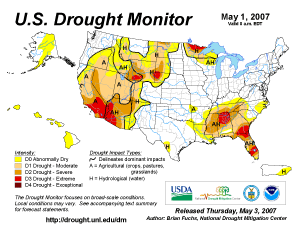
Across the United States, extreme drought conditions were observed in areas of Wyoming and Nebraska, as well as northern Minnesota and throughout much of the Desert Southwest
and the Southeast region. |
U.S. Drought Monitor
|
A six-year drought, characterized as the worst in the nation's history, continued in Australia. Australian Prime Minister John Howard warned that irrigation in much of the nation's farmland would be banned unless significant
rainfall occurred during the next month. There was only enough water in the Murray-Darling river system for drinking purposes (BBC News).
|


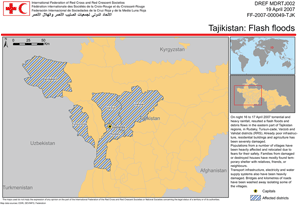
Tajikistan Affected Areas
In the eastern region of Tajikistan, heavy rain generated flash floods and landslides during the
night of April 16 affecting around 12,000 people (IFRC). |
|
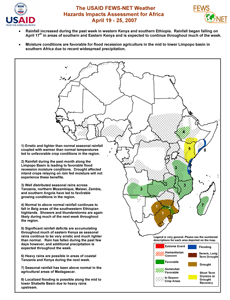
In North Africa, heavy rainfall during the last two weeks of April produced floodings that caused at least 22 deaths (IFRC). |
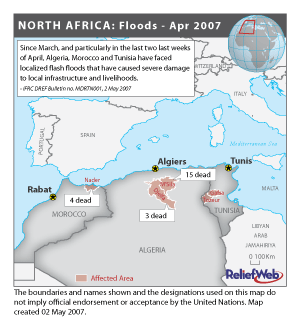
North Africa's Affected Areas
|


An outbreak of severe thunderstorms including 14 reported tornadoes occurred on the 3rd in parts of the Mississppi and Tennessee River Valley region. There were at least 7
injuries reported, but no fatalities. |
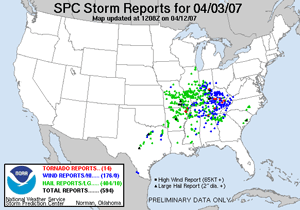
U.S. Storm Reports
|
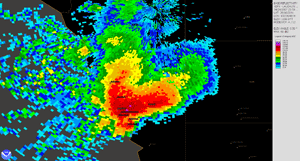
Texas-Mexico Severe Weather
| Severe thunderstorms moved across south central Texas producing a devastating tornado on the night of April 24 that killed 10 people along the Texas-Mexico
border. The tornado destroyed two schools and damaged hundreds of homes (Associated Press). |


Tropical Cyclone Jaya developed in the southern Indian Ocean on March 30, and made landfall in northeastern
Madagascar between Sambava and Antalaha on the 3rd with maximum sustained winds near 150 km/hr (80 knots or 90 mph). Jaya was the sixth tropical cyclone to impact Madagascar since December 2006.
|
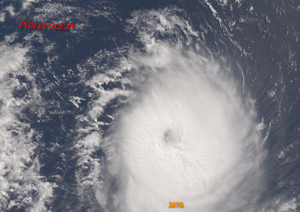
Tropical Cyclone Jaya
|


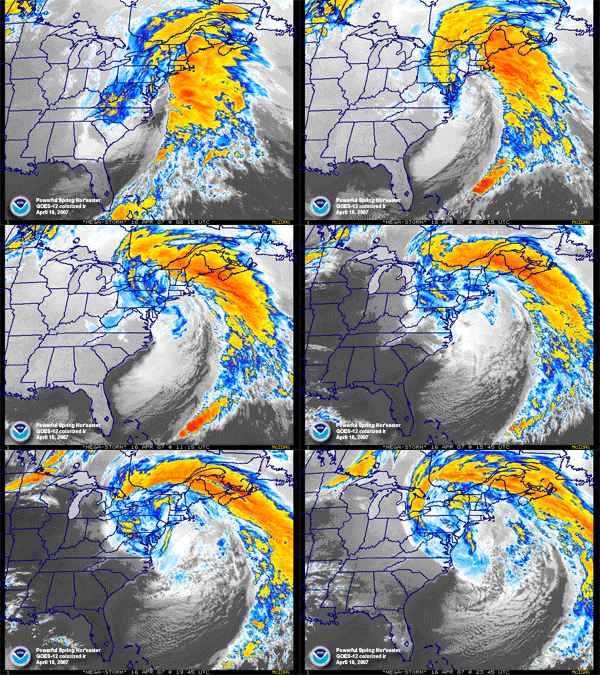
U.S. Nor'easter
|
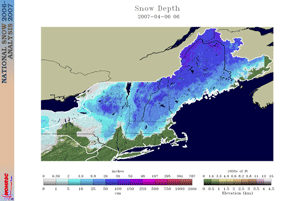
A major storm system, otherwise known as a Nor'easter, moved up the Eastern Seaboard during the 15th-17th.
Strong winds produced power outages that affected hundreds of thousands from South Carolina to Maine, while heavy rainfall generated flooding in areas of the Mid-Atlantic and Northeast. Rain and wind hampered runners of the Boston Marathon, with
a strong headwind causing the slowest race finish since 1977 (Reuters). New York City had its second-rainiest day ever, with 192 mm (7.57 inches) on the 15th. The record for the heaviest daily rainfall is 210 mm (8.28 inches) set on September
23, 1882 (NWS). Higher elevations of northern New York, Vermont and New Hampshire received snowfall accumulations as high as 43 cm (17 inches). A total of 17 deaths were attributed to the storm (Associated Press).
|
A storm system brought strong winds to southern California, fanning brush fires and producing power outages. At least 76,000 power outages were reported in the greater Los Angeles area on the 12th (AFP).
|


A late-season Arctic air mass brought record cold to areas of the Midwest, Plains, Mid-Atlantic and Southeast during April 4-10. Significant damages to crops were reported, including North Carolina which had an estimated $112 million in losses. Temperatures dipped well below
freezing, with many areas observing morning low temperatures as low as -6°C (21°F). Additional information can be found on the April 2007 Cold Wave page. |

For all climate questions other than questions concerning this report,
please contact the National Climatic Data Center's Climate Services
Division:
- Climate Services Division
NOAA/National Climatic Data Center
151 Patton Avenue, Room 120
Asheville, NC 28801-5001
fax: 828-271-4876
phone: 828-271-4800
email: ncdc.orders@noaa.gov
|

For further information on the historical climate perspective presented in this report, contact:
- Scott Stephens
NOAA/National Climatic Data Center
151 Patton Avenue
Asheville, NC 28801-5001
fax: 828-271-4328
email: Scott.Stephens@noaa.gov
|
|


