Maps and Data - Means of Transportation to Work
Find maps and charts showing transportation data and trends related to alternative fuels and vehicles.
OR
Sort by:
130 results
-
Vehicles: AFVs and HEVs
-
-
AFV Acquisitions by Regulated Fleets (by Fleet Type)
Trend of S&FP AFV acquisitions by fleet type from 1992-2014 Last update August 2016
-
-
-
AFV Acquisitions by Regulated Fleets (by Fuel Type)
Trend of S&FP AFV acquisitions by fuel type from 1992-2015 Last update August 2016
-
-
-
AFV and HEV Model Offerings, By Manufacturer
Trend of AFV models produced by OEMs from 1991-2016 Last update March 2016
-
-
-
ARRA Electrification Projects
Last update November 2012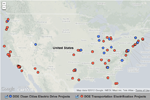
-
-
-
Annual Vehicle Credits Earned and Used by Regulated Fleets
Trend of S&FP EPAct credits traded and transactions from 1997-2014 Last update August 2016
-
-
-
BioFuels Atlas
BioFuels Atlas is an interactive map for comparing biomass feedstocks and biofuels by location. This tool helps users select from and apply biomass data layers to a map, as well as query and download biofuels and feedstock data. The state zoom function summarizes state energy use and infrastructure for traditional and bioenergy power, fuels, and resources. The tool also calculates the biofuels potential for a given area. BioFuels Atlas was developed by the National Renewable Energy Laboratory with funding from the DOE Biomass Program.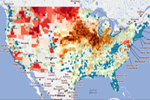
-
-
-
Biodiesel Purchases by EPAct-Regulated Fleets
Trend of State and Fuel Provider Biodiesel Purchases from 1999-2015 Last update August 2016
-
-
-
Clean Cities Alternative Fuel and Advanced Vehicle Inventory
Advanced fuel and advanced vehicle inventory reported by Clean Cities coalitions 2004-2014 Last update January 2016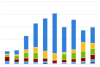
-
-
-
Clean Cities Petroleum Savings by AFV Type
Trend of displacement by fuels used in AFVs from 2004-2014 Last update March 2016
-
-
-
Exemptions from EPAct by Regulated Fleets
Trend of S&FP vehicle exemptions requested and granted from 1997-2015 Last update August 2016
-
-
-
Light-Duty AFV, HEV, and Diesel Model Offerings, By Fuel Type
Trend of vehicle models capable of using various fuel types from 1991-2016 Last update September 2016
-
-
-
On-Road AFVs Made Available by Year
Trend of AFVs capable of using various fuels that were sold, leased, or converted from 1998-2012 Last update April 2013
-
-
-
TransAtlas
TransAtlas is an interactive map that uses a Google Maps interface to display: Existing and planned alternative fueling stations Alternative fuel production facilities Light-duty vehicle density Roads and political boundaries Users can customize the map display and print and query the underlying data. TransAtlas is part of a suite of geographic analysis tools for renewable energy developed at the National Renewable Energy Laboratory.
-
-
-
Types of Vehicles by Weight Class
Last update June 2012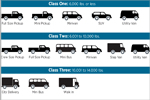
-
-
-
U.S. HEV Sales by Model
Trend of sales by HEV models from 1999-2015 Last update January 2016
-
-
-
U.S. Plug-in Electric Vehicle Sales by Model
Monthly Plug-in Electric Vehicle (PEV) sales by model from December 2010 to December 2015 Last update January 2016
-
-
-
U.S. Transit Buses by Fuel Type
Trend of buses powered by various fuels in the U.S. from 2007-2015 Last update August 2016
-
-
-
Vehicle Credits Traded by Regulated Fleets
Trend of S&FP EPAct credits traded and transactions from 1997-2015 Last update August 2016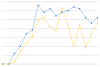
-
-
-
Vehicle Weight Classes & Categories
Last update June 2012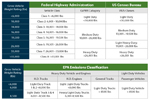
-
-
Vehicles: Fuel Consumption and Efficiency
-
-
Average Annual Fuel Use of Major Vehicle Categories
Comparison of fuel use (per vehicle) among vehicle types Last update June 2015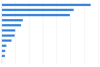
-
-
-
Average Annual Vehicle Miles Traveled of Major Vehicle Categories
Comparison of miles traveled (per vehicle) among vehicle types Last update June 2015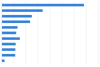
-
-
-
Average Fuel Economy at Different Road Grades
Trend of Fuel Economy and Consumption at different road grades, for various vehicle types Last update August 2014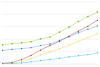
-
-
-
Average Fuel Economy of Major Vehicle Categories
Comparison of fuel economy among vehicle types Last update June 2015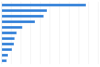
-
-
-
Average Per-Passenger Fuel Economy of Various Travel Modes
Comparison of per-passenger fuel economy for various modes of transportation. Last update December 2016
-
-
-
Clean Cities Petroleum Savings by Fuel Economy and VMT Reductions
Trend of displacement by fuel economy improvement and VMT reduction projects from 2004-2013 Last update December 2014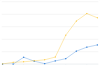
-

Means of Transportation to Work
| 1980 | 1990 | 2000 | 2010 | 2012 | |
| Drive alone | 62193 | 84215 | 97102 | 105841 | 106520 |
| Car pool | 19065 | 15378 | 15635 | 14418 | 14032 |
| Public transportation | 6008 | 5891 | 5868 | 6873 | 6968 |
| Taxicab | 167 | 179 | 200 | 164 | 159 |
| Walk only | 5413 | 4489 | 3759 | 3962 | 3938 |
| Work at home | 2180 | 3406 | 4184 | 5760 | 5978 |
| Other means | 703 | 809 | 901 | 1216 | 1196 |
| Bicycle | 468 | 467 | 488 | 717 | 786 |
| Motorcycle | 419 | 237 | 142 | 305 | 317 |
Source: Oak Ridge National Laboratory. Transportation Energy Data Book #33. Table 8.16
This chart shows how people commuted to and from their workplaces between 1980 and 2012. The percentage of people driving alone increased during the years shown, as the percentage of people carpooling decreased. Walking and carpooling have become less popular, but advances in communication technology have allowed more people to work from home.
Print