Maps and Data
Find maps and charts showing transportation data and trends related to alternative fuels and vehicles.
OR
Sort by:
5 results
-
-
Clean Cities Annual Petroleum Savings
Trend of displacement by all fuel and technology types from 1994-2013 Last update November 2014
-
-
-
Clean Cities Cumulative Petroleum Savings
Trend of displacement by all fuel and technology types from 1994-2014 Last update January 2016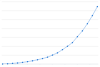
-
-
-
Clean Cities Petroleum Savings by AFV Type
Trend of displacement by fuels used in AFVs from 2004-2014 Last update March 2016
-
-
-
Clean Cities Petroleum Savings by Fuel Economy and VMT Reductions
Trend of displacement by fuel economy improvement and VMT reduction projects from 2004-2013 Last update December 2014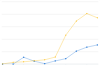
-
-
-
Clean Cities Petroleum Savings by Idle Reduction
Trend of displacement by idle reduction policies and technologies from 2004-2013 Last update December 2014
-

Clean Cities Annual Petroleum Savings
| 1994 | 1995 | 1996 | 1997 | 1998 | 1999 | 2000 | 2001 | 2002 | 2003 | 2004 | 2005 | 2006 | 2007 | 2008 | 2009 | 2010 | 2011 | 2012 | 2013 | |
| Million GGEs Displaced | 14.661601 | 26.257135 | 44.636261 | 42.601614 | 67.430476 | 86.992812 | 92.062378 | 119.179912 | 132.560577 | 156.05423 | 233.3 | 250 | 360 | 375 | 412 | 670 | 645 | 805 | 907 | 1007.8075523398275 |
Source: Clean Cities annual metrics reports, 2004-2013.
Notes: Savings are measured in gasoline-gallon equivalents (GGEs), representing a quantity of fuel with the same amount of energy contained in a gallon of gasoline.
This chart shows the petroleum savings achieved through Clean Cities activities from 1994 through 2013. Petroleum savings due to Clean Cities initiatives in 2013 exceeded 1 billion gallons.
Print