| |
 |
|
Trends
in Physician Productivity
Trends in physician productivity are important
to consider when projecting supply of physician services.
If physicians are more (or less) productive in future years,
then more (or less) services can be provided with any given
number of active physicians. Measures of physician productivity
in the literature include the following:
- Hours
spent providing patient care. Projected changes
over time in average hours worked are incorporated into
the PSM. Our analysis of AMA’s 1998 Socioeconomic
Monitoring System (SMS) file finds that female physicians
tend to work approximately 15 percent less time in patient
care than do their male counterparts after controlling
for age, specialty, and IMG status. Physicians over age
65 and under age 36 work fewer hours per year than their
middle-aged colleagues, and over time average hours in
direct patient care for these two groups has been declining
(Exhibit 5). Part of the decline for the younger group
reflects a growing proportion of women in the workforce.
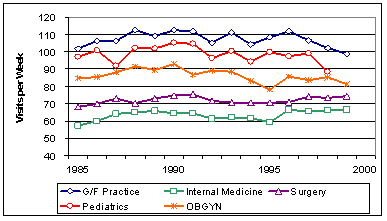
- Number
of patients seen.
Changes in the use of non-physician clinicians (NPC) and
other health workers, technological advances, epidemiological
trends, amount of time spent with patients per visit,
and changes in the healthcare operating environment could
all affect the average number of patients seen per physician
during a given period of time. AMA publications show that
the average number of patient visits declined during the
1990s (Exhibit 6) due mainly to a decline in hospital
round visits (Exhibit 7), with office visits per physician
remaining relatively constant (Exhibit 8). Unfortunately,
these statistics are no longer collected by AMA.
- Resource-Based
Relative Value Scale.
A set of codes developed by the Center for Medicare and
Medicaid Services (CMS), the Resource-Based Relative Value
Scale (RBRVS), helps determine the Medicare fee schedule.
(Many private insurers also use a form of the RBRVS).
The RBRVS has three cost components, one of which is the
Relative Value Unit (RVU) that measures physician work
as a function of both the time and skill necessary to
provide a particular service. More complex and time consuming
services have higher RVUs. Data from the Medical Group
Management Association (MGMA) cost survey suggest that
between 1998 and 2002 the median annual work RVUs per
physician were either constant or possibly increasing
slightly (Exhibit 9). For example, during this period
median work RVUs per physician in multi-specialty practices
increased from 5,368 to 5,489 (about 0.6 percent per year).
For multi-specialty, hospital-owned practices, the annual
growth rate over this four-year period was approximately
7 percent, while for practices not owned by hospitals,
the annual growth rate was approximately -0.5 percent.
The number of support staff per FTE physician has also
increased (Exhibit 10). Between 1996 and 2002, the number
of support staff per FTE physician in multi-specialty
practices increased 1.4 percent annually. The annual growth
rate for family practice groups over this six-year period
was 1.2 percent. To capture these trends in greater physician
productivity, for our sensitivity analysis, we project
a physician supply scenario under the assumption that
productivity will increase by 1 percent annually.
[6]
Exhibit
5. Trends in Annual Hours Worked
 [D]
[D]
Source:
AMA Physician Socioeconomic Statistics, various years; 2002
estimates from BHPr.
Exhibit
6. Average Total Visits per Week
 [D]
[D]
Source:
AMA Physician Socioeconomic Statistics, various years.
Exhibit
7. Average Hospital Round Visits per Week
 [D]
[D]
Source:
AMA Physician Socioeconomic Statistics, various years.
Exhibit
8. Average Office Visits per Week
 [D]
[D]
Source: AMA Physician
Socioeconomic Statistics, various years.
Exhibit
9. Physician Work RVUs per FTE Physician
 [D]
[D]
Source: MGMA Cost Survey, various years.
Exhibit
10. Total Support Staff per FTE Physician
 [D]
[D]
Source: MGMA Cost Survey, various years.
|