 |
|
|
|
 |
||||||||||
|
|
|
|
|||||||||||||
|
||||||||||||||||
|
|
How To... - Read A Data Table - Prevalence Tables
|
|||||||||||||||||||||||||||||||||||||||||||||||||||||||||||||||||||||||||||||||||||||||||||||||||||||||||||||||
|
|||||||||||||||||||||||
Use the PedNSS Table 2, Summary of Health Indicators to examine the
overall prevalence for all of the health indicators that are collected
through PedNSS for infants and children who are served by the public
health program.
Use the PNSS Table 2, Summary of Health Indicators tables to examine the
overall prevalence for all the health indicators that are collected
through PNSS for pregnant, breastfeeding, and postpartum women who are
served by the public health program.
PedNSS Summary of Health Indicators tables include:
PNSS Summary of Health Indicators tables include:
These tables can be used to answer questions such as:
The following paragraphs provide general information about the table data that will help you with interpretation.
Records
The PedNSS table analysis includes one unique record per child for the
reporting period of January 1 through December 31.
The PNSS table analysis includes one record for each pregnancy.
Prevalence
The number of records included in the PedNSS data table analysis varies
with each health indicator.
The number of records included in the PNSS analysis for each health
indicator varies because some health indicators include data from all
records (complete, prenatal only, or postpartum only) while others include
complete and prenatal only records or complete and postpartum only records.
Comparisons of Contributor-level and National Data
For contributor-level (contributor, U.S. Territory, and tribal
government) tables, the data include both contributor prevalence and PedNSS
national prevalence, allowing you to compare the two values. Because the
national prevalence of health indicators is relatively stable from one year
to the next, the tables use national data from the prior year. This
practice allows the CDC to produce the contributor’s PedNSS and PNSS reports as soon
as the data for the reporting period are received from the contributor.
New Data Items
The following health indicators have recently been added to the
PedNSS:
The following health indicators have recently been added to the PNSS:
Note that data for these indicators have not yet been submitted by all contributors. However, as these data are collected by contributors and sent to the CDC, they will also be included in the tables.
Data Constraints
Since breastfeeding data are collected only during the early postpartum
period, the PNSS data can be used only to monitor the initiation of
breastfeeding and not duration. However, because PedNSS data is collected
for infants up to 2 years of age it can be used to determine
breastfeeding prevalence for both initiation and duration.
We're going to look at sections of the PedNSS Table 2C Summary of Health Indicators. You can click on the View Sample Table link below each portion to review the entire table. The sample table is numbered to match the portions shown below.
|
|
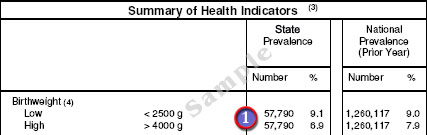
The number of Low Birthweight records with valid birthweight data included in the analysis is 57,790; the prevalence (%) is 9.1%. The numbers of Low Birthweight and High Birthweight records are the same (57,790) because this value is the total number of records for infants born during the reporting year with valid birthweight data. |
Review the definition of Birthweight and its prevalence calculation.
|
|
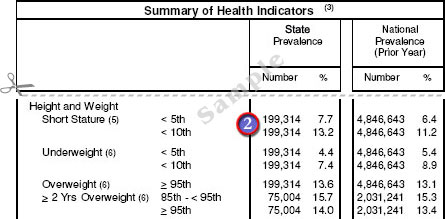
The number of Underweight and Overweight records (199,314)
is the same because this value is the number of records for children from
birth to 5 years of age with valid Height and Weight data. The number of records (75,004) for children 2 years of age or older for 85th to less than 95th (Risk of Overweight) and greater than or equal to 95th (Overweight) is the same (75,004) and includes only records that have valid Height and Weight data for children 2 to 5 years of age. |
Review the definition of Growth Indicators and its prevalence calculation.
|
|
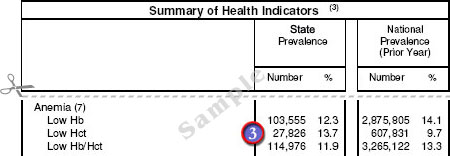
The Anemia data include records with either valid hemoglobin (Hb) or valid hematocrit (Hct) values for children 6 months to 5 years of age. If both Hb and Hct values are reported, only the Hb value is included. As a result, the number of Hb/Hct records (114,976) does not equal the sum of the Hb records (103,555) and the Hct (27,826) records. |
Review the definition of Anemia and its prevalence calculation.
|
|
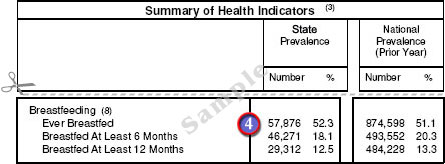
The number of Ever Breastfed records (57,876) includes the number
of infants born during the reporting period with valid breastfeeding data. The Ever Breastfed data and the Birthweight data are based on infants born during the reporting period. Note that the number of records differs for the Ever Breastfed (57,876) analysis and the Birthweight (57,790) analysis because more valid data were recorded for Ever Breastfed than for Birthweight. The number of infants Breastfed for At Least 6 Months (46,271) includes infants who reached 6 months of age and who had a visit with valid breastfeeding data recorded during the reporting period. The number of infants Breastfed For At Least 12 Months (29,312) includes infants who reached 12 months of age and who had a visit with valid breastfeeding data recorded during the reporting period. |
Review the definition of Breastfeeding and its prevalence calculation.
We're going to look at sections of the PNSS Table 2C, Summary of Health Indicators. You can click on the View Sample Table link below each portion to review the entire table. The sample table is numbered to match the portions shown below.
|
|
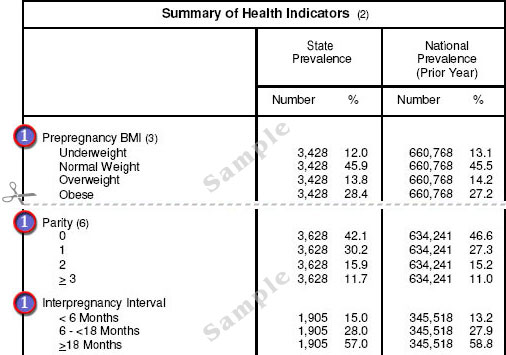
Prepregnancy BMI, Parity, and
Interpregnancy Interval are health indicators that are collected at
both the prenatal and postpartum visits. Therefore, all records
(Complete, Prenatal, and Postpartum) with valid data are included in
the analysis of these health indicators. Note that the Parity
(3,628) analysis includes more records with valid data than does
Prepregnancy BMI (3,428) and Interpregnancy Interval
(1,905). The number of Complete, Prenatal, and Postpartum records with valid height and weight data is 3,428. The Prepregnancy BMI distribution shows the percent of women in each weight category. The prevalence (%) of obese women is 28.4%. |
Review the definition of Prepregnancy BMI and
its prevalence calculation.
Review the definition of
Parity and
its prevalence calculation.
Review the definition of
Interpregnancy Interval and
its prevalence calculation.
Review the definition of Complete, Prenatal and Postpartum records.
|
|
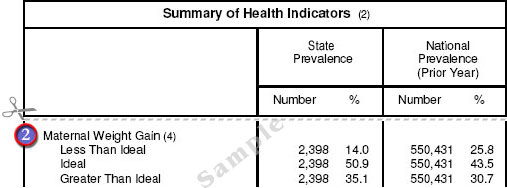
Maternal Weight Gain is based on pregnancy BMI and weight gain during pregnancy. The number of Complete and Postpartum records with both valid Prepregnancy BMI (calculated from height and weight) and Maternal Weight Gain data is 2.398. The prevalence (%) of women who gained less than the IOM recommended weight gain based on their prepregancy BMI is 14%. |
Review the definition of
Maternal Weight Gain and
its prevalence calculation.
Review the definition of
Prepregnancy BMI and
its prevalence calculation.
|
|
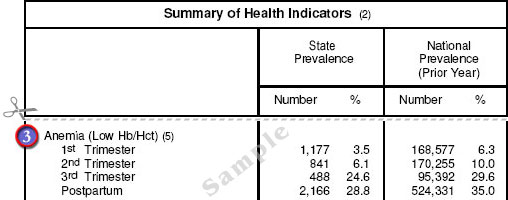
Anemia prevalence during the
prenatal period is reported by pregnancy trimesters and postpartum
because anemia is defined differently for each time period. The Postpartum analysis includes the number of complete and postpartum records with valid Hemoglobin (Hb) and Hemocrit (Hct) measurements taken at greater than 4 weeks or 28 days postpartum. At 4 weeks or more postpartum, Hb and Hct measurements are expected to return to pre-pregnancy or first trimester levels. |
Review the definition of Anemia and its prevalence calculation.
|
|
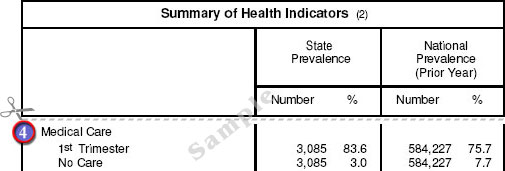
The number of Medical Care records (3,085) includes only Complete and Postpartum records. Medical care data is always collected at the prenatal visit. It must be collected at the postpartum visit if the woman was not enrolled in the program participation in the PNSS while she was pregnant or if she reported at the prenatal visit that she had not begun medical care. The proportion of women who received medical care in the first trimester of their pregnancy was 83.6% compared to 3% of women that reported receiving no care. |
Review the definition of Medical Care and its prevalence calculation.
|
|
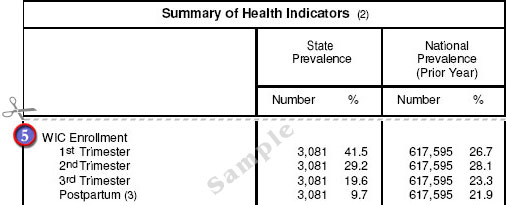
WIC Enrollment includes all records, Complete, Prenatal, and Postpartum (3,081). The distribution shows when women enrolled in WIC initially for infants born during this reporting period. For example, 9.7% of women enrolled in WIC for the first time at their postpartum visit. |
Review the definition of
WIC Enrollment and
its prevalence calculation.
Review the definition of Complete, Prenatal and Postpartum records.
|
|
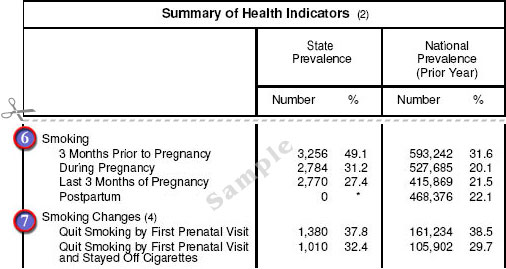
The Smoking indicators show smoking status before and during pregnancy, and during last three months of pregnancy. |
|
|
The Smoking Changes indicators monitor changes in the
smoking behaviors of women who smoked prior to pregnancy. The
prevalence of Quit Smoking by the First Prenatal Visit and
Stayed Off Cigarettes can be used to monitor smoking behaviors
during pregnancy as it shows women who smoked 3 months prior to
pregnancy but quit at the first prenatal visit and stayed off
cigarettes during their pregnancy. This analysis includes only Complete
records, that is, women having both a prenatal and postpartum visit.
The percent of women who smoked prior to pregnancy quit smoking by their first prenatal visit was 37.8%. Of these, 32.4% did not smoke in the last 3 months of pregnancy. So, you can conclude that about 5% of women who smoked prior to pregnancy and quit at their first visit, resumed smoking during the last 3 months of pregnancy. The number of records included in Quit Smoking by the First Prenatal Visit and Stayed Off Cigarettes analysis is 1,010. Note that the number of Complete records (1,010) included in this analysis had valid data for all of the following data items:
|
Review the definition of
Smoking and
its prevalence calculation.
Review the definition of
Smoking Changes and
its prevalence calculation.