How To... - Read A Data Table - Prevalence Tables
Summary of Breastfeeding Indicators
Use
Use the PedNSS Table 3, Summary of Breastfeeding Indicators to examine
the prevalence of breastfeeding at various points in time. The time
periods that show the greatest decrease in breastfeeding prevalence may
indicate critical times when breastfeeding interventions could be
implemented.
This table can be used to answer questions such as:
- What is the difference in the prevalence of breastfed at 1+ week
compared to breastfed at 6+ weeks?
Interpreting the Data
The following paragraphs provide general information about the table
data that will help you with interpretation.
Prevalence
Prevalence represents the percent of infants at a given age who are being
breastfed. The number of records with valid breastfeeding data differs at
each time period for breastfeeding duration because the infant must meet
both of the following conditions:
- Be at least the age indicated in the time period.
- Have had a visit at which valid breastfeeding data were collected.
Comparisons of Contributor-level and National Data
For contributor-level (C)
tables, the data include both contributor prevalence and PedNSS national
prevalence, allowing you to compare the two values. Because the national
prevalence of health indicators is relatively stable from one year to the
next, the tables show national data from the prior year. This allows the CDC to produce the contributor’s PedNSS and PNSS reports as soon as the
data for the reporting period are received from the contributor.
Sample: PedNSS Table 3C, Summary of Breastfeeding
Indicators
We're going to look at sections of the PedNSS Table 3C, Summary of
Breastfeeding
Indicators. You can click on the View
Sample Table link below each portion to review the entire table. The sample
table is numbered to match the portions shown below.
Breastfed
 |
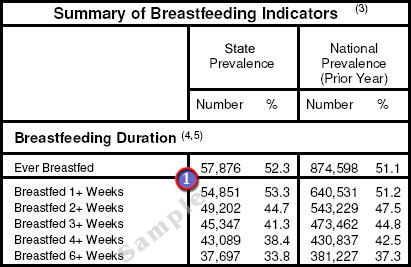
Ever Breastfed includes 57,876 records with
valid breastfeeding data for infants in this state born during the
reporting period of January 1 through December 31. The prevalence (%)
is 52.3%.
Note the decline in prevalence between Breastfed 1+ Weeks and
Breastfed 2+ Weeks (from 53.3% to 44.7%). Another significant
decline (to 33.8%) occurs at Breastfed 6+ Weeks, the time when
many mothers return to work.
Note that the prevalence for Breastfed 1+ Weeks (53.3%) is
higher than the prevalence for Ever Breastfed (52.3%). As these
figures illustrate, some analyses may show that slightly more infants
are breastfed at older ages. This difference may occur because of
variation in the infants included in the records selected for
breastfeeding analysis. |
Review the definition of
Breastfeeding and
its prevalence calculation.
back to top
|