Department of Health and Human Services
Centers for Disease Control and Prevention
|
|
|||||||||||||
|
|
|
|
|
||||||||||
|
|
|
|
|
|
2008 Atlas of Stroke Hospitalizations Among Medicare Beneficiaries
|
||||||||||||||||||||||||||||||||||||||||||||||
|
||||||||||||||||||||||||||||||||||
In this section, we placed multiple maps on a page to enhance the reader’s ability to visually compare geographic patterns. To ease visual comparison across maps in this section, we only included the continental United States, and we omitted the frequency distribution graphs.
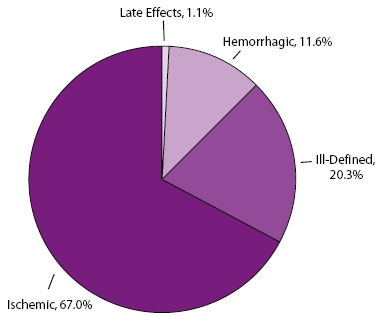
Ischemic Stroke—a stroke caused by a deficiency of blood to the brain, usually due to the functional constriction or blockage of a blood vessel.
Hemorrhagic Stroke—a stroke caused by the escape of blood (bleeding) to the brain, usually due to the rupture of a blood vessel.
Ill-Defined Stroke—diagnosis or classification used when there is not enough medical information to classify a stroke as ischemic or hemorrhagic.
Two-thirds (67.0%) of the stroke hospitalizations among Medicare beneficiaries in this Atlas were ischemic, 11.6% were hemorrhagic, 20.3% were ill-defined, and 1.1% were late effects from a stroke (Figure 7.1). Hospitalizations due to late effects from a stroke were not mapped in this Atlas because the numbers are too small to produce stable county-level rates.
For this section, the first set of maps compares the geographic patterns of different discharge destinations for the total population of Medicare beneficiaries in this study. The next sets of maps compare the geographic patterns for each discharge destinations by race/ethnicity.
Home—residence or place other than a health care facility where patient receives self-care, health service care, or IV drug therapy.
Skilled Nursing Facility—facility that meets specific regulatory certification requirements and that primarily provides inpatient skilled nursing care and related services to patients who require medical, nursing, or rehabilitative services but does not provide the level of care or treatment available in a hospital.
Other Care Facility—intermediate care, short-term care, or other type of facility. This category does not include skilled nursing facilities.
Any Care Facility—skilled nursing, intermediate care, short-term care, or other type of facility. This category includes skilled nursing facilities and other care facilities (listed above).
Died Before Discharge—patient died during the hospital stay.
Died Within 30 Days—patient died within 30 days of admission to the hospital for a stroke.
* Categories of discharge destination defined by Centers for Medicare & Medicaid Services.
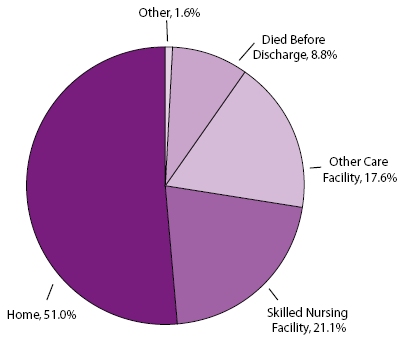
During 1995–2000, more than half of all Medicare beneficiaries hospitalized
for a stroke were discharged home (51.0%). Skilled nursing facilities were
the second largest destination (21.1%), followed by other care facilities
(17.6%) and other discharge outcomes (1.6%). (This category is not reported
in Section 3 because it is so small.) In addition, 8.8% of patients died
before discharge (Figure 7.2), and 13.9% died
within 30 days of being admitted to the hospital.
For this section, the first set of maps compares the geographic patterns of hypertension, diabetes, and atrial fibrillation for the total population of Medicare beneficiaries in this Atlas. The next sets of maps compare the geographic patterns for each of the selected comorbidities by race/ethnicity.
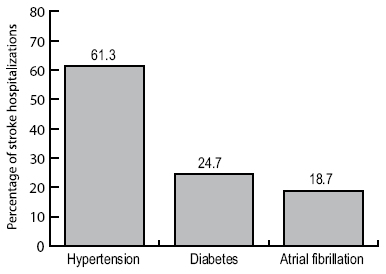
Atrial fibrillation—a type of abnormal heart rhythm.
Diabetes—a metabolic disorder characterized by inadequate secretion or use of insulin and excessive amounts of sugar in the blood.
Hypertension—the condition of repeatedly having an abnormally high blood pressure. The current clinical definition is systolic blood pressure >140 mm/Hg and/or diastolic blood pressure >90 mm/Hg.
Among the stroke hospitalizations examined in this Atlas, 61.3% included a diagnosis of hypertension, 24.7% included a diagnosis of diabetes, and 18.7% included a diagnosis of atrial fibrillation (Figure 7.3).
Stroke hospitalizations were defined as those for which the principal diagnosis on the Medicare hospital claim form was cerebrovascular disease, indicated by codes 430–434 and 436–438 according to the International Classification of Diseases, 9th Revision, Clinical Modification (ICD-9-CM). Hospitalizations for which the principal diagnosis was transient ischemic attacks (ICD-9-CM code 435) were excluded.
For each map, the counties are categorized according to quintile; the darkest color represents counties with the highest rates or percentages (depending on the data being presented), and the lightest color represents counties with the lowest rates or percentages. All county-level rates and percentages have been spatially smoothed to enhance the stability in counties with small populations. Counties are categorized as having “insufficient data” if the sum of stroke hospitalizations in the index county plus the neighboring counties is less than 20 or if the Medicare population is less than 10. For percentages, a relative standard error >30% is an additional criterion for categorizing a county as having insufficient data. For a detailed explanation of the methods, see Appendix B.
In the Medicare data sets, the accuracy of codes for Hispanic race and ethnicity is limited because these codes are not reported separately. For example, a person who is white and Hispanic is reported as either white or Hispanic. This reporting practice can result in misclassification of race and ethnicity. According to 1996 data, the probability that the racial/ethnic designation on Medicare claim forms is correct is 96.6% for whites and 95.5% for blacks, but only 19.4% for Hispanics. At the same time, the probability that a person identified as Hispanic in the Medicare data set is actually Hispanic is 98% (Arday SL, Arday DR, Monroe A, Zhang MD. HCFA’s racial and ethnic data: current accuracy and recent improvements. Health Care Financing Review 2000;21[4]:107–16). Together, these data suggest that Hispanics are underreported in the Medicare data sets and that this underreporting could introduce bias into the results presented here.
Stroke Hospitalization Rates for the Total Population
Stroke Hospitalization Rates for All Strokes
Stroke Hospitalization Rates for Ischemic Stroke
Stroke Hospitalization Rates for Hemorrhagic Stroke
Stroke Hospitalization Rates for Ill-defined Stroke
Stroke Hospitalizations by Discharge Status
Stroke Hospitalizations: Discharged Home
Stroke Hospitalizations: Discharged to a Skilled Nursing Facility
Stroke Hospitalizations: Discharged to Other Care Facility
Stroke Hospitalizations: Discharged to Any Care Facility
Stroke Hospitalizations: Died Before Discharge
Stroke Hospitalizations: Died Within 30 Days
Stroke Hospitalizations: Selected Comorbidities
Stroke Hospitalizations: Hypertension
Stroke Hospitalizations: Diabetes
Stroke Hospitalizations: Atrial Fibrillation
| Back to Top |
Page last reviewed: April 9, 2008
Page last modified: April 9, 2008
Content source: Division for Heart Disease and Stroke
Prevention,
National Center for Chronic Disease Prevention and
Health Promotion
|
|
|
||||||||||||
|
 Section
Seven: Maps
At-a-Glance
Section
Seven: Maps
At-a-Glance