Department of Health and Human Services
Centers for Disease Control and Prevention
|
|
|||||||||||||
|
|
|
|
|
||||||||||
|
|
|
|
|
|
2008 Atlas of Stroke Hospitalizations Among Medicare Beneficiaries
|
||||||||||||||||||||||||||||||||||||||||||||||
|
||||||||||||||||||||||||||||||||||
This section documents the geographic patterns of hospitals and stroke specialists in the United States in 2002. We focus on short-term general hospitals because people who suffer a stroke are most likely to be admitted there. A map of the geographic distribution of all short-term general hospitals is included, along with separate maps for subsets of short-term general hospitals with the following services: neurological services, emergency departments, and rehabilitation care units. The maps of stroke specialists indicate the geographic distribution of nonfederal (e.g., those not working at Veterans Administration hospitals) neurologists and neurosurgeons.
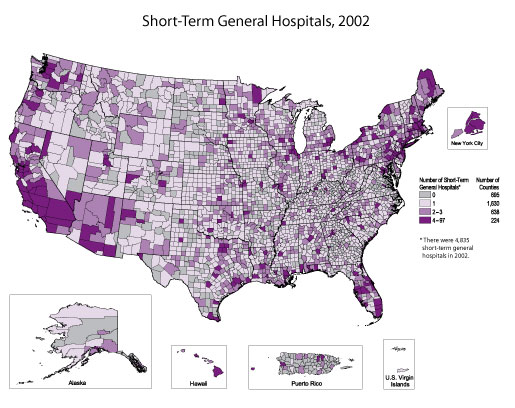
In 2002, there were 4,835 short-term general hospitals in the United States. Nearly half of all U.S. counties (49%) had only 1 short-term general hospital, approximately 20% had 2 or 3, and close to 10% had 4 or more. The frequency distribution indicates that a very small percentage of counties had more than 8 short-term general hospitals. About 22% of all counties in the United States did not have a short-term general hospital.
Counties with 4 or more short-term general hospitals (n = 224) were located primarily in the Northeast, the southern tip of Florida, and states along the Pacific coastline and scattered among parts of the interior of the United States. Urban areas were most likely to have 4 or more short-term general hospitals, supported by the fact that 46% of counties with 4 or more short-term general hospitals had a population of at least 500,000.
Counties with no short-term general hospitals (n = 695) were scattered through most of the interior of the United States, including parts of Texas, the Great Plains region, much of the rural South, and sections of both Appalachia and the midwestern states.
In 2002, there were 1,559 short-term general hospitals with neurological services. Nearly 14% of all U.S. counties had only 1 short-term general hospital with neurological services, nearly 7% had 2 or 3, and only 3% had 4 or more. About 77% of all counties in the United States did not have a short-term general hospital with neurology services.
Counties with 4 or more short-term general hospitals with neurological services (n = 97) were located primarily in large urban areas, including New York City, Detroit, Chicago, Miami, Houston, Dallas, Phoenix, Los Angeles, and Seattle. In 78% of the counties with 4 or more short-term general hospitals with neurological services, the total population size was at least 500,000.
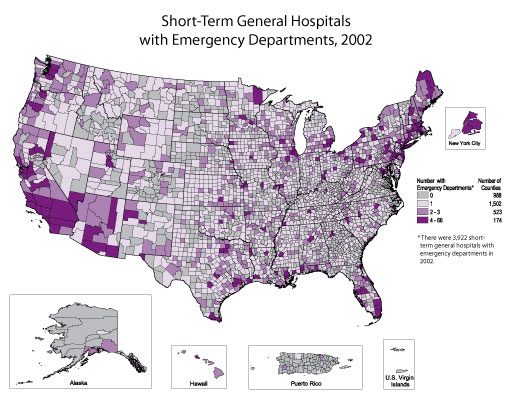
In 2002, there were 3,922 short-term general hospitals with emergency departments. Almost 47% of all U.S. counties had only 1 short-term general hospital with an emergency department, 16% had 2 or 3, and only 5% had 4 or more. The frequency distribution indicates that a very small percentage of counties had more than 8 short-term general hospitals with emergency departments. About 31% of all counties in the United States did not have a short-term general hospital with an emergency department.
Counties with 4 or more short-term general hospitals with emergency departments (n = 174) were located primarily in the Northeast, along the Pacific Coast, in southern Florida, and in urban areas, including Detroit, Chicago, Houston, Dallas, Phoenix, Los Angeles, and Seattle. In 56% of the counties with 4 or more short-term general hospitals with emergency departments, the total population size was at least 500,000. Counties without any short-term general hospitals with emergency departments (n = 988) were scattered throughout the United States.
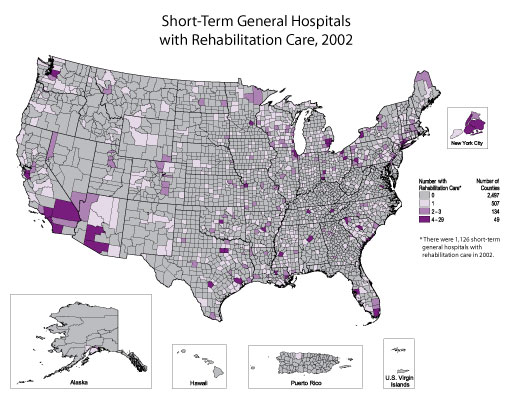
In 2002, there were 1,126 short-term general hospitals with rehabilitation care services. Nearly 16% of all U.S. counties had only 1 short-term general hospital with rehabilitation care services, 4% had 2 or 3, and only 2% had 4 or more. The frequency distribution indicates that a very small percentage of counties had more than 4 short-term general hospitals with rehabilitation care services. About 78% of all counties in the United States did not have a short-term general hospital with rehabilitation care services.
Counties with 4 or more short-term general hospitals with rehabilitation care services (n = 49) were located primarily in large urban areas, including New York City, Detroit, Chicago, Miami, Houston, Dallas, Phoenix, Los Angeles, and Seattle. In 76% of the counties with 4 or more short-term general hospitals with rehabilitation care services, the total population size was at least 500,000.
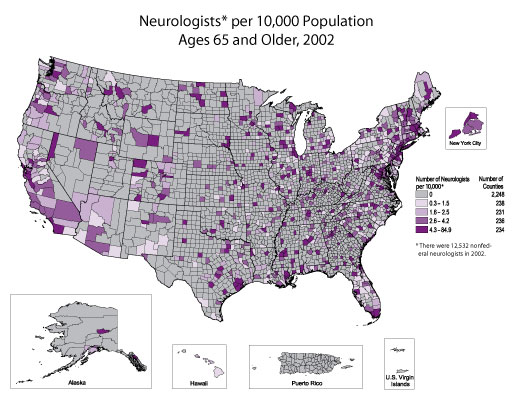
In 2002, according to the Bureau of Health Professions, there were 12,532 nonfederal neurologists in the United States. Most counties in the United States (71%) did not have a neurologist. Among the 939 counties with a neurologist, the frequency distribution indicates that the number of neurologists per 10,000 population ages 65 and older was generally between 2 and 5. Counties with the highest ratios (e.g., those in the top quartile, with at least 4.3 neurologists per 10,000 population ages 65 and older) were scattered around the country in both metropolitan and rural areas.
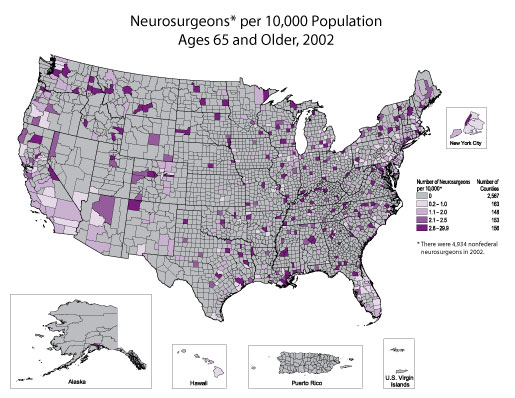
In 2002, according to the Bureau of Health Professions, there were 4,934 nonfederal neurosurgeons in the United States. The vast majority of counties in the United States (81%) did not have a neurosurgeon. Among the 620 counties with a neurosurgeon, the frequency distribution indicates that the number of neurosurgeons per 10,000 population ages 65 and older was generally between 1 and 5. Counties with the highest ratios (e.g., those in the top quartile, with at least 2.6 neurosurgeons per 10,000 population ages 65 and older) were scattered around the country in both metropolitan and rural areas.
Data on hospitals and stroke specialists were obtained from the Area Resource File, a compilation of health-related data abstracted from multiple data sources and made available by the Bureau of Health Professions, U.S. Department of Health and Human Services. All hospital data are from the American Hospital Association’s Annual Survey of Hospitals.
Short-term general hospitals are defined by the American Hospital Association as hospitals serving short-term hospital stays (usually fewer than 30 days) and providing general medical and surgical services.
For each map of hospitals, counties are categorized according to the number of hospitals per county. The darkest color represents counties with at least 4 of the hospitals described in the title, and the lightest color represents counties with only 1 such hospital. Counties with 0 hospitals are shaded gray.
For each map of specialists, counties are categorized according to the number of specialists per 10,000 population ages 65 and older. The darkest color represents counties with the largest number of specialists. Counties with 0 specialists are shaded gray. The frequency distribution in the bottom right corner of each map shows the distribution of the number of counties with the respective number of hospitals. For a detailed explanation of the methods, see Appendix B.
| Back to Top |
Page last reviewed: April 9, 2008
Page last modified: April 9, 2008
Content source: Division for Heart Disease and Stroke
Prevention,
National Center for Chronic Disease Prevention and
Health Promotion
|
|
|
||||||||||||
|
 Section
Five: Maps of Hospitals
and Stroke Specialists
Section
Five: Maps of Hospitals
and Stroke Specialists