Department of Health and Human Services
Centers for Disease Control and Prevention
|
|
|||||||||||||
|
|
|
|
|
||||||||||
|
|
|
|
|
|
2008 Atlas of Stroke Hospitalizations Among Medicare Beneficiaries
|
||||||||||||||||||||||||||||||||||||||||||||||||||||||||||||||||||||||||||||||||||||||||||||||||||||||||||||||||||||||||||||||||||||||||||||||||||||||||||||||||||||||||||||||||||||||||||||||||||||||||||||||||||||||||||||||||||||||||||||||||||||||||||||||||||||||||||||||||||||||||||||||||||||||||||||||||||||||||||||||||||||||||||||||||||||||||||||||||||||||||||||||||||||||||||||||||||||||||||||||||||||||||||
|
||||||||||||||||||||||||||||||||||
Within the study population for this Atlas, there were an average 27,759,446 Medicare beneficiaries per year during 1995–2002 (Table 1.1). Beneficiaries were excluded from the Atlas if they were members of a health maintenance organization (HMO); died before July 1 of any of the covered years; were younger than 65 years on July 1 of any of the covered years; lived outside the United States, Puerto Rico, or the U.S. Virgin Islands; or were reported to have a racial/ethnic designation other than black, Hispanic, or white.
As seen in Table 1.1, just under 60% of the beneficiaries were women. The distribution of beneficiaries by age group indicates that just over half (52.6%) were in the youngest age group (65–74 years), 34.8% were in the middle age group (75–84 years), and 12.6% were in the oldest age group (≥85 years). The distribution of beneficiaries by race/ethnicity indicates that 7.8% were black, 1.5% were Hispanic, and 87.7% were white.
| Number† | Percentage | |
|---|---|---|
|
Gender |
||
|
Total |
27,759,446 | 100.0 |
| Women | 16,407,237 | 59.1 |
| Men | 11,352,209 | 40.9 |
|
Race/Ethnicity |
||
| Blacks | 2,174,185 | 7.8 |
| Women | 1,342,166 | 4.8 |
| Men | 832,019 | 3.0 |
|
Hispanics‡ |
426,647 | 1.5 |
| Women | 237,359 | 0.9 |
| Men | 189,288 | 0.7 |
|
Whites |
24,363,649 | 87.7 |
| Women | 14,363,649 | 51.7 |
| Men | 10,000,000 | 36.0 |
|
Age Group (years) |
||
| 65–74 | 14,598,204 | 52.6 |
| 75–84 | 9,658,919 | 34.8 |
| ≥85 | 3,502,323 | 12.6 |
* Data exclude managed care enrollees; residents outside the United
States, Puerto Rico, or the U.S. Virgin Islands; those younger than 65
years; and those who died by July 1 of each year (1995–2002).
† Average number of beneficiaries per year, 1995–2002.
‡ Hispanics may be underrepresented in this Atlas. See
Appendix B
for more details.
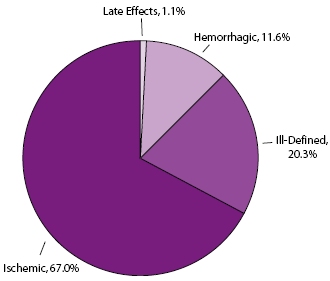
Stroke hospitalizations for Medicare beneficiaries during the study period are shown by various categories such as age group and stroke subtype (Table 1.2). A total of 3,807,605 hospitalizations for stroke occurred during 1995–2002, with an average of 475,951 per year. Just over one-third (34.3%) of the stroke hospitalizations occurred in the youngest age group (65–74 years), the largest percentage (43.5%) occurred in the middle age group (75–84 years), and 22.2% occurred in the oldest age group (≥85 years). Two-thirds (67.0%) of the stroke hospitalizations were classified as ischemic, 11.6% as hemorrhagic, 20.3% as ill-defined, and 1.1% as late effects from stroke. (See also Figure 1.1.)
| Number | Percentage* | |
|---|---|---|
|
Race/Ethnicity/Gender |
||
|
Total |
3,807,605 | 100.0 |
| Women | 2,142,466 | 56.3 |
| Men | 1,665,139 | 43.7 |
|
Blacks |
373,584 | 9.8 |
| Women | 233,015 | 6.1 |
| Men | 140,569 | 3.7 |
|
Hispanics† |
51,661 | 1.3 |
| Women | 27,016 | 0.7 |
| Men | 24,645 | 0.6 |
|
Whites |
3,281,427 | 86.2 |
| Women | 1,826,017 | 48.0 |
| Men | 1,455,410 | 38.2 |
|
|
||
| 65–74 | 1,306,695 | 34.3 |
| 75–84 | 1,656,777 | 43.5 |
| ≥85 | 844,133 | 22.2 |
|
|
||
| 1995 | 508,830 | 13.4 |
| 1996 | 513,622 | 13.5 |
| 1997 | 508,548 | 13.4 |
| 1998 | 481,932 | 12.7 |
| 1999 | 459,825 | 12.1 |
| 2000 | 445,183 | 11.7 |
| 2001 | 447,166 | 11.7 |
| 2002 | 442,499 | 11.6 |
|
|
||
| Hemorrhagic | 441,856 | 11.6 |
| Ischemic | 2,549,811 | 67.0 |
| Ill-Defined | 773,859 | 20.3 |
| Late Effects | 42,079 | 1.1 |
* Percentage may not be equal to 100 because of rounding.
† Hispanics may be underrepresented in this Atlas. See Appendix B
for more details.
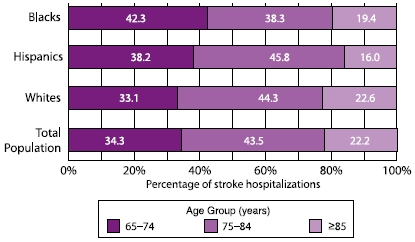
The age distribution for stroke hospitalizations differed across racial/ethnic groups (Figure 1.2). For blacks, the highest percentage of strokes (42.3%) occurred in the youngest age group (65–74 years), with lower percentages in the two older age categories. Whites (44.3%) and Hispanics (45.8%), on the other hand, had the highest percentages in the middle age group (75–84 years).
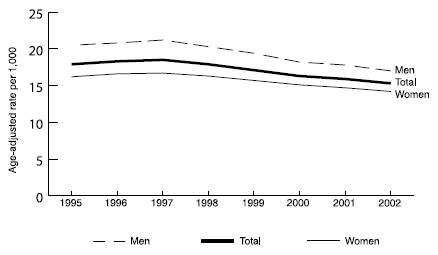
During 1995–2002, the age-adjusted stroke hospitalization rate per 1,000 decreased slightly, from 17.5 to 15.0 (Figure 1.3). The rate was higher for men than for women throughout the study period, and both genders experienced very small declines in stroke hospitalization rates during this time.
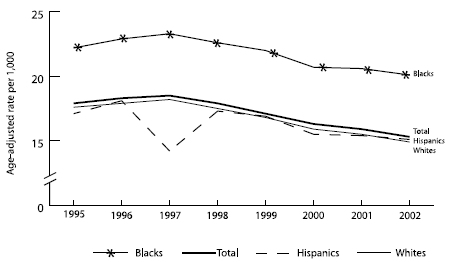
Slight decreases in age-adjusted stroke hospitalization rates were observed for each race/ethnicity during 1995–2002 (Figure 1.4). Throughout this time, blacks experienced rates 25% higher than the total population. Rates for whites and Hispanics closely followed the trend for the total population. However, in 1997, the curve for Hispanics deviated downward for just 1 year. This change is most likely a data anomaly resulting from a change to the Medicare race/ethnicity codes that occurred in that year (Arday SL, Arday DR, Monroe A, Zhang MD. HCFA’s racial and ethnic data: current accuracy and recent improvements. Health Care Financing Review 2000;21[4]:107–16).
* Stroke hospitalization rates are the average annual rates for 1995–2002.†
The stroke hospitalization rate for the total Medicare population is
age-adjusted to the 2000 U.S. standard population, aged >65 years.
* Average annual stroke hospitalization rates per 1,000 Medicare
beneficiaries are directly age-adjusted using the 2000 U.S. standard
population aged >65 years.
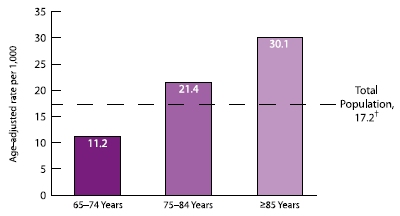
Stroke hospitalization rates increased sharply with increasing age (Figure 1.5 and Table 1.3). The rate (30.1 per 1,000) for the oldest age group (≥85) was almost three times higher than the rate (11.2 per 1,000) for the youngest age group (65–74 years).
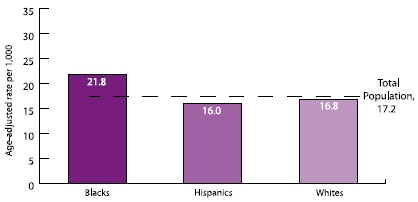
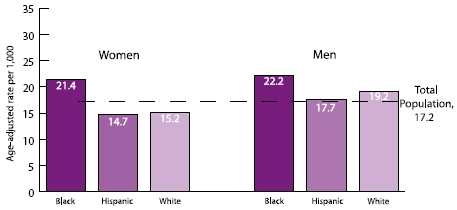
Stroke hospitalization rates were highest among blacks (21.8 per 1,000), while the rates for Hispanics (16.0 per 1,000) and whites (16.8 per 1,000) were similar (Figure 1.6 and Table 1.3). These race/ethnicity patterns were maintained within each gender group (Figure 1.7). Both black women and black men had substantially higher rates than their Hispanic and white counterparts. Within each racial/ethnic group, the stroke hospitalization rates were somewhat higher for men than for women.
| Stroke Hospitalization Rate | |
|---|---|
|
Race/Ethnicity/Gender |
|
|
Total |
17.2 |
| Women | 15.7 |
| Men | 19.4 |
|
Blacks |
21.8 |
| Women | 21.4 |
| Men | 22.2 |
|
Hispanics† |
16.0 |
| Women | 14.7 |
| Men | 17.7 |
|
Whites |
16.8 |
| Women | 15.2 |
| Men | 19.2 |
|
Age Group (years)* |
|
| 65–74 | 11.2 |
| 75–84 | 21.4 |
| ≥85 | 30.1 |
|
|
|
| 1995 | 17.9 |
| 1996 | 18.3 |
| 1997 | 18.5 |
| 1998 | 17.9 |
| 1999 | 17.1 |
| 2000 | 16.3 |
| 2001 | 15.9 |
| 2002 | 15.3 |
|
|
|
| Hemorrhagic | 2.0 |
| Ischemic | 11.5 |
| Ill-Defined | 3.5 |
| Late Effects | 0.2 |
*Not age-adjusted.
* Average annual stroke hospitalization rates per 1,000 Medicare beneficiaries are directly age-adjusted using the 2000 U.S. standard population aged >65 years.
The distribution of stroke subtypes varied somewhat by age group (Figure 1.8). The percentage of hemorrhagic strokes increased from 11.0% in the youngest age group (65–74 years) to 12.4% in the oldest age group (>85 years). The percentage of ischemic strokes decreased with increasing age, while the percentage of ill-defined strokes increased with increasing age. The percentage of late effects from stroke was similar for each age group.
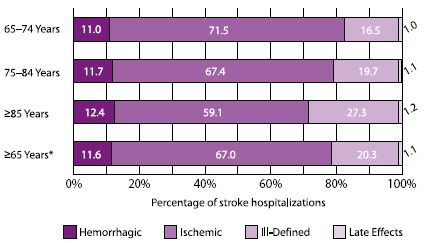
*Combination of all three age groups.
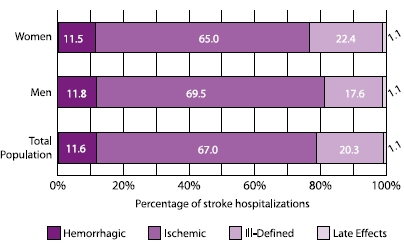
The distribution of stroke subtypes by gender is shown in Figure 1.9. The percentage of hemorrhagic strokes was about the same for women (11.5%) and men (11.8%). The percentage of ischemic strokes was somewhat higher for men (69.5%) than for women (65.0%), while the percentage of ill-defined strokes was higher for women (22.4%) than for men (17.6%).
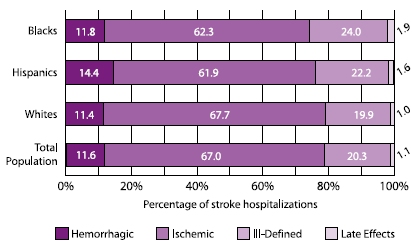
The distribution of stroke subtypes for different racial/ethnic groups is shown in Figure 1.10. Hispanics had the highest percentage of hemorrhagic strokes (14.4%). Whites had the highest percentage of ischemic strokes (67.7%) and the lowest percentages of both hemorrhagic (11.4%) and ill-defined strokes (19.9%). Blacks had the highest percentage of ill-defined strokes (24.0%).
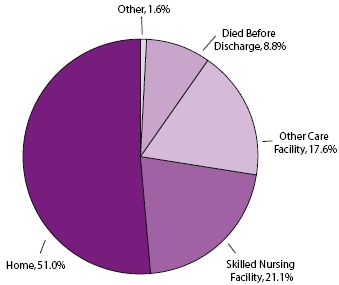
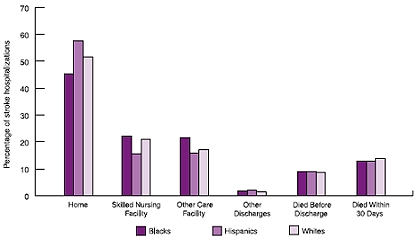
Among Medicare beneficiaries hospitalized for stroke, 51.0% were discharged home, 21.1% were discharged to a skilled nursing facility, 17.6% to other care facilities, and 8.8% died before being discharged (Table 1.4 and Figure 1.11).
| Discharge Status (%) | Mortality (%) | |||||
|---|---|---|---|---|---|---|
| Characteristic | Home |
Skilled Nursing Facility |
Other Care Facility |
Other Discharge Outcomes |
Died Before Discharge |
Died Within 30 Days* |
|
Age Group (years) |
||||||
| 65–74 | 63.3 | 12.1 | 16.7 | 1.4 | 6.6 | 9.0 |
| 75–84 | 50.7 | 21.1 | 18.1 | 1.6 | 8.6 | 13.1 |
| >85 | 32.5 | 35.1 | 18.2 | 1.7 | 12.5 | 23.0 |
| Gender | ||||||
| Women | 46.5 | 24.4 | 18.2 | 1.6 | 9.2 | 14.9 |
| Men | 56.7 | 16.8 | 16.8 | 1.5 | 8.2 | 12.6 |
| Race/Ethnicity | ||||||
| Blacks | 45.2 | 22.3 | 21.6 | 1.8 | 9.0 | 12.9 |
| Hispanics | 57.6 | 15.7 | 15.8 | 1.9 | 9.1 | 13.0 |
| Whites | 51.6 | 21.0 | 17.1 | 1.5 | 8.7 | 13.9 |
| Stroke Subtype | ||||||
| Hemorrhagic | 24.0 | 22.0 | 22.0 | 1.9 | 30.1 | 38.1 |
| Ischemic | 57.5 | 19.1 | 16.3 | 1.5 | 5.6 | 9.9 |
| Ill-Defined | 45.0 | 26.6 | 19.6 | 1.5 | 7.3 | 13.4 |
| Late Effects | 49.4 | 30.7 | 16.2 | 1.7 | 2.0 | 6.8 |
| Total | 51.0 | 21.1 | 17.6 | 1.6 | 8.8 | 13.9 |
*Died within 30 days of admission to the hospital for a stroke.
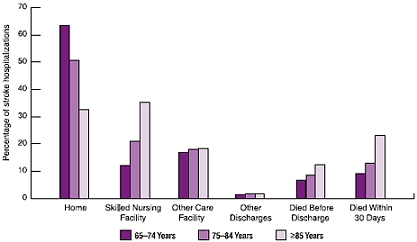
The percentage of stroke hospitalizations discharged home decreased with increasing age, was higher among Hispanics compared with blacks and whites, and was approximately two times higher among people who experienced ischemic strokes (57.5%) compared with those with hemorrhagic strokes (24.0%) (Table 1.4, Figure 1.12, and Figure 1.13).
The percentage of Medicare beneficiaries hospitalized for stroke who died before discharge or were discharged to skilled nursing facilities or other care facilities increased with age (Table 1.4 and Figure 1.12).
The pattern of discharge status by race/ethnicity indicates that blacks had the lowest percentage of stroke hospitalizations discharged home (45.2%) and the highest percentage of stroke hospitalizations discharged to other care facilities (21.6%). Hispanics, on the other hand, had the highest percentage of stroke hospitalizations discharged home (57.6%) and the lowest percentages discharged to skilled nursing facilities (15.7%) and other care facilities (15.8%). Whites were in the intermediate range for each of the three major discharge destinations (Table 1.4 and Figure 1.12).
The overall 30-day mortality among Medicare beneficiaries hospitalized with stroke was 13.9%. The percentage increased with increasing age and was similar for the three racial/ethnic groups (blacks: 12.9%; Hispanics: 13.0%; whites: 13.9%) (Table 1.4, Figure 1.12, and Figure 1.13).
Note: For Figures 1.12 and 1.13, the exact percentage for each bar is listed in Table 1.4.
County distributions of stroke hospitalization rates highlight the geographic disparities in the burden of stroke for each racial and ethnic group during 1995–2002 (Figure 1.14). Examination of the tails of the distribution indicates that some of the county rates for blacks and Hispanics are much higher than the rates for whites.
The peaks in the curve for each racial/ethnic group indicate the most common county stroke hospitalization rates for the corresponding racial/ethnic group. For blacks, the peak occurs at much higher rates of stroke hospitalizations compared with whites and Hispanics. This emphasizes the heavy excess burden of stroke among blacks compared with whites and Hispanics.

*Stroke hospitalization rates are spatially smoothed to enhance the stability of rates in counties with small populations.
| Back to Top |
Page last reviewed: April 9, 2008
Page last modified: April 9, 2008
Content source: Division for Heart Disease and Stroke
Prevention,
National Center for Chronic Disease Prevention and
Health Promotion
|
|
|
||||||||||||
|
 Section
One: National Patterns of Stroke Hospitalizations
Section
One: National Patterns of Stroke Hospitalizations