Tropical Cyclone Report
Hurricane Ivan
2 - 24 September 2004
Stacy R. Stewart
National Hurricane Center
16 December 2004
(updated 27 May 2005)
Ivan was a classical, long-lived Cape Verde
hurricane that reached Category 5 strength three times on the
Saffir-Simpson Hurricane Scale (SSHS). It was also the strongest
hurricane on record that far south east of the Lesser Antilles.
Ivan caused considerable damage and loss of life as it passed
through the Caribbean Sea.
a. Synoptic History
Ivan developed from a large tropical wave
that moved off the west coast of Africa on 31 August. Although the
wave was accompanied by a surface pressure system and an impressive
upper-level outflow pattern, associated convection was limited and
not well organized. However, by early on 1 September, convective
banding began to develop around the low-level center and Dvorak
satellite classifications were initiated later that day. Favorable
upper-level outflow and low shear environment was conducive for the
formation of vigorous deep convection to develop and persist near
the center, and it is estimated that a tropical depression formed
around 1800 UTC 2 September. Figure 1 depicts the "best track" of
the tropical cyclone's path. The wind and pressure histories are
shown in Figure 2a and Figure 3a,
respectively. Table 1 is a listing of the
best track positions and intensities.
Despite a relatively low latitude
(9.7°N), development continued and it is estimated that
the cyclone became Tropical Storm Ivan just 12 h later at 0600 UTC
3 September. Ivan continued on a generally westward motion south of
10°N latitude and steadily strengthened, becoming a
hurricane at 0600 UTC 5 September centered about 1000 n mi east of
Tobago in the southern Windward Islands. After reaching hurricane
strength, the rate of intensification increased dramatically and
Ivan underwent an 18 h period of rapid intensification (rate
> 30 kt/24 h). Satellite intensity estimates suggest that
the intensity increased 50 kt while the central pressure decreased
39 mb during that time and Ivan reached its first peak intensity of
115 kt at 0000 UTC 6 September. This made Ivan the southernmost
major hurricane on record. However, almost as quickly as Ivan
strengthened it also weakened -- as much 20 kt over the following
24 h. Conventional and microwave satellite data indicated the
probable cause of the rapid weakening was due to mid-level dry air
that got wrapped into the center of the hurricane and eroded the
eyewall convection.
Immediately following the 24 h weakening
period, Ivan began a second strengthening phase (Figure 2b) that also
contained a 12 h period of rapid intensification. During that time,
Ivan was under surveillance by U.S. Air Force Reserve
reconnaissance aircraft as the hurricane approached the southern
Windward Islands. Reports from the aircrew indicated that Ivan had
strengthened to a strong category 3 (SSHS) hurricane as the center
passed about 6 n mi south-southwest of Grenada. The eye diameter at
that time was about 10 n mi, and the strongest winds raked the
southern portion of the island.
After passing Grenada and into the
southeastern Caribbean Sea, the hurricane's intensity leveled off
until 1800 UTC on 8 September when another brief period of rapid
intensification ensued. Reconnaissance aircraft data indicated Ivan
reached its second peak intensity -- 140 kt and category 5 strength
(SSHS) -- just 12 h later. This was the first of three occasions
that Ivan reached the category 5 level. The previous
west-northwestward motion of 14-15 kt gradually decreased while
Ivan moved across the central Caribbean Sea toward Jamaica.
Although a large subtropical ridge to the north remained intact,
steering currents weakened and Ivan's forward speed decreased to
less than 10 kt on 11 September while the hurricane made a turn to
the west, keeping the center at least 20 n mi offshore the southern
coast of the island. As Ivan passed south of Jamaica it weakened to
category 4 strength, in part, due to an eyewall replacement or
concentric eyewall cycle (Figure 4a).
The combination of the westward
turn and weakening kept the strongest winds offshore.
Later that day Ivan began moving
west-northwestward away from Jamaica. Ivan rapidly intensified to
category 5 strength a second time while it remained in a low
vertical shear environment, and reached its third peak intensity at
1800 UTC 11 September. However, Ivan only maintained its maximum
intensity of 145 kt and category 5 status for 6 h before it
weakened back to a category 4 hurricane on 12 September. The
weakening trend was short-lived and Ivan re-strengthened to
category 5 for its third and final time when it was about 80 n mi
west of Grand Cayman Island. Although Ivan was weakening while the
center passed south of Grand Cayman on 12 September, the hurricane
still brought sustained winds just below category 5 strength
(Table 3) to the island.
This resulted in widespread wind damage, and a
storm surge that completely over swept the island except for the
extreme northeastern portion.
On 13 September, Ivan approached a weakness
in the subtropical ridge over the central Gulf of Mexico and turned
northwestward at a slower speed of 8-10 kt. As Ivan moved over the
northwestern Caribbean Sea, the combination of the impressive
upper-tropospheric outflow that was being enhanced by the
south-southwesterly upper-level flow ahead of an approaching trough
and the very warm water in that region probably helped the
hurricane maintain category 5 strength for an unusually long 30 h.
Once again major land areas were spared the full force of the
hurricane because the 20 n mi diameter eye and strongest winds
passed through the Yucatan channel just off the extreme western tip
of Cuba (Figure 4b). Hurricane force conditions were reported across
portions of western Cuba, but the effects were far less than what
occurred on Grenada, Jamaica, and Grand Cayman when Ivan passed
those areas.
Shortly after emerging over the southern
Gulf of Mexico early on 14 September, Ivan turned
north-northwestward and then northward. A steady weakening trend
also ensued as moderate southwesterly flow on the east side of a
large mid- to upper-level trough over the central United States and
northeastern Mexico gradually caused the vertical shear to increase
across the hurricane. As Ivan neared the northern U.S. Gulf coast,
the upper-level wind flow ahead of the trough became more westerly
and strengthened to more than 30 kt, which helped to increase the
shear even more and advect dry air into the inner core region.
Despite the unfavorable environmental conditions, the presence of
cooler shelf water just offshore and eyewall replacement cycles,
Ivan weakened only slowly and made landfall as a 105 kt hurricane
(category 3 on the SSHS; see Figure 2c and Figure 3b.)
at approximately
0650 UTC 16 September, just west of Gulf Shores, Alabama. By this
time, the eye diameter had increased to 40-50 n mi (Figure 4c), which
resulted in some of the strongest winds occurring over a narrow
area near the southern Alabama-western Florida panhandle
border.
After Ivan moved across the barrier islands
of Alabama, the hurricane turned north-northeastward across eastern
Mobile Bay and weakened into a tropical storm 12 h later over
central Alabama. A gradual turn to the northeast occurred shortly
thereafter and Ivan became a tropical depression by 0000 UTC 17
September over northeast Alabama. A northeastward motion at 10-14
kt continued for the next 36 h before Ivan merged with a frontal
system and became an extratropical low over the DelMarVa peninsula
around 1800 UTC 18 September. However, even as a weak tropical
depression, Ivan was a prodigious rain and tornado producer causing
flash floods and tornado damage across much of the southeastern
United States.
Even as an extratropical low, the remnant
circulation of Ivan was identifiable in both surface and upper-air
data. Over the next 3 days, the low moved south and southwestward
and eventually crossed the southern Florida peninsula from the
Atlantic the morning of 21 September and emerged over the
southeastern Gulf of Mexico later that afternoon. As Ivan moved
westward across the warm water of the Gulf, the low began to
re-acquire warm core, tropical characteristics as showers and
thunderstorms started developing near the well-defined low-level
circulation center. During the morning of 22 September, Ivan
completed a large anticyclonic loop and by 1800 UTC reconnaissance
aircraft reports indicated that it had become a tropical depression
again over the central Gulf of Mexico. Ivan regained tropical
strength 6 h later when it was located about 120 n mi south of the
mouth of the Mississippi River. Tropical Storm Ivan turned
northwestward and made landfall as a tropical depression in extreme
southwestern Louisiana around 0200 UTC 24 September. After
landfall, Ivan quickly dissipated later that morning over the upper
Texas coastal area about 20 n mi northwest of Beaumont. Including
its extratropical phase, Ivan existed for 22.5 days and produced a
track more than 5600 n mi long.
b. Meteorological Statistics
Observations in Ivan (Figure 2 and Figure 3)
include satellite-based Dvorak technique intensity estimates from
the Tropical Analysis and Forecast Branch (TAFB), the Satellite
Analysis Branch (SAB) and the U. S. Air Force Weather Agency
(AFWA), as well as flight-level and dropwindsonde observations from
flights of the 53rd Weather Reconnaissance Squadron of
the U. S. Air Force Reserve Command (AFRES), and flight-level and
stepped frequency microwave radiometer (SFMR) observations from the
NOAA Aircraft Operations Center. Microwave satellite imagery from
NOAA polar-orbiting satellites, the NASA Tropical Rainfall
Measuring Mission (TRMM), the NASA QuikSCAT, and Defense
Meteorological Satellite Program (DMSP) satellites were also
helpful in monitoring Ivan. In addition, National Weather Service
Doppler radars (Slidell, LA, Mobile, AL, and Elgin AFB, FL) were
extremely useful for tracking this tropical cyclone. An example is
seen in Figure 4, a reflectivity image of Ivan shortly after the
time of landfall on 16 September from the Mobile WSR-88D Doppler
radar, which shows the large eye of the hurricane inland over
extreme southern Alabama.
A total of 112 reconnaissance center
investigations were made in Ivan - 95 by the U.S. Air Force Reserve
and 17 by the NOAA Hurricane Hunters. In addition, the NOAA
Gulfstream-IV jet aircraft conducted 12 synoptic surveillance
flights around the periphery of the hurricane. The maximum
flight-level (700 mb) wind observed was 161 kt at 1917 UTC 11
September, when Ivan was located about 45 n mi west-southwest of
the western tip of Jamaica. However, during Ivan's traversal across
the Caribbean Sea, there were 12 additional flight-level wind
reports of 150 kt or greater. The lowest aircraft measured pressure
was 910 mb at 0005 UTC 12 September, less than 5 h after the
maximum flight-level wind was observed, and also at 2053 UTC 13
September, which was about 2 h after flight-level winds of 157 kt
were measured on two separate flight legs. Several research flights
were made by NOAA aircraft when Ivan was moving over the Gulf of
Mexico. The maximum SFMR surface wind observed was 99 kt at 0135
UTC 16 September about 58 n mi south of the Alabama coast. In the
Caribbean Sea area, the maximum observed wind over land was
sustained 130 kt with a gust to 149 kt on Grand Cayman Island at
1345 UTC 12 September. A 10-min average wind of 116 kt was reported
at Pedro Bank, which is about 50 n mi southwest of Kingston. This
was also the upper limit of reporting range of the wind observing
equipment. Doppler radar velocity data indicated wind speeds as
high as 97 kt may have affected much of Jamaica, especially over
the higher elevations. In the United States, the strongest winds
measured were an unofficial report from a storm chaser near Gulf
Shores, Alabama of sustained 77 kt with a gust to 99 kt at 0602 UTC
16 September. Also, an unofficial wind gust of 126 kt at
approximately 0600 UTC 16 September was observed by the sailboat
Odalisque anchored in Wolf Bay north of Orange Beach,
Alabama. The highest official wind report was 76 kt sustained with
a gust to 93 kt at the Pensacola Naval Air Station, Florida at 0629
UTC 16 September.
The lowest pressures observed during Ivan's
first U.S. landfall were unofficial reports 943.1 mb and 947.9 mb,
which came from storm chasers based in Fairhope, Alabama. In
addition, an automated weather observing station (AWOS) on the oil
drilling platform Ram Powell-VJ956, located about 70 n mi
south of Mobile Bay, Alabama (Table 3)
reported a sustained wind of
102 kt with a gust to 135 kt at 2256 UTC 15 September at an
elevation of 400 ft ASL. The instrument failed immediately after
this report was obtained and remained inoperable for the next 4
days. Aircraft reconnaissance reports around that time suggest that
the oil rig was located north-northeast of Ivan's center and just
outside the radius of maximum winds.
Although Ivan was weakening as it made its
first U.S. landfall, it is estimated to have been a category 3
hurricane when it reached the Alabama coast. As Ivan neared the
U.S. Gulf coast on 15 and 16 September, the hurricane came under
the surveillance of National Weather Service (NWS) WSR-88D Doppler
radars located in Slidell, LA, Mobile, AL, and Eglin AFB, FL There
was a robust and persistent velocity maximum located within
vigorous convection in the northeastern quadrant of the outermost
concentric eyewall as Ivan was coming ashore. For several hours
prior to landfall, the velocities were actually higher in this area
than in the vicinity of the inner eyewall. Within the outer eyewall
existed several 1-2 n mi2
patches of 120-122 kt inbound Doppler velocities (some individual
gates contained 123.4 kt velocities) at around 6,000 ft ASL. Using
122 kt as being representative of a smoothed peak and applying a
reduction factor of 0.85 (standard reconnaissance flight-level
reduction for 6000 ft) yields a surface estimate of 104 kt. In
addition to the Doppler radar velocity data, a 700 mb flight-level
wind of 120-kt was observed just south of Gulf Shores, AL at 0724
UTC 16 September (Figure 2c) in the same general area where the
aforementioned maximum Doppler radar velocities were observed. The
120-kt flight-level wind converts to approximately a 108-kt surface
wind using the standard 0.90 reduction factor from the 700
mb-level. A blend of those two equivalent surface wind values
yields an intensity of 105 kt Ivan's first U.S. landfall. This
intensity estimate is also consistent with the 99-kt SFMR surface
wind data that was collected by a NOAA WP-3 aircraft more than 6 h
before landfall. In addition, assuming a typical outward slope to
the eyewall, the narrow band of strongest winds at landfall likely
occurred over Perdido Key and Perdido Bay, which would have been to
the west of the Pensacola Naval Air Station and to the east of the
Florida Coastal Monitoring Program portable wind tower at Gulf
Shores, Alabama.
Ship reports of winds of tropical storm
force associated with Ivan are given in Table 2, and selected
surface observations from land stations and data buoys are given in
Table 3, Table 4, and Table 5.
With the exception of a couple of ships that
had sought shelter in the harbors around Grenada, the majority of
ships remained clear of Ivan's strong winds.
Heavy rainfall exceeding 10 inches occurred
on several of the Caribbean Islands
(Table 3 and Table 5) and caused
extensive freshwater flooding and/or mud slides. Some peak rainfall
totals are 16.20 in from Tobago, 13.33 in from western Cuba, and
12.14 in from Grand Cayman. Across Jamaica, several locations
received more than 25 in (635 mm) of rainfall. A few of the largest
rainfall totals were 28.37 in (720.8 mm) at Ritchies, 27.92 in
(709.4 mm) at Mavis Bank, and 26.83 in (681.5 mm) at both Craighead
and Worthy Park. The Meteorological Service of Jamaica also
"noted that rainfall data representative of a number of
stations in southern parishes were lost due to damage done to rain
gages by Hurricane Ivan." In the United States, rainfall totals
generally ranged from 3-7 in along a large swath from Alabama and
the Florida panhandle northeastward across the eastern Tennessee
Valley and into the New England area (Figure 6) In fact, when Ivan
was an extratropical low pressure system, it produced rainfall
totals in excess of 7 in as far north as New Hampshire and as far
south as the Florida east coast. Even as a weakening tropical
depression, Ivan produced rainfall amounts exceeding 7 in across
eastern Texas. However, there were two isolated extreme rainfall
reports exceeding 15 in -- 15.75 in at television station WEAR-TV3
in Pensacola, Florida and 17.00 in at Cruso, North Carolina.
Widespread flooding resulted from Ivan's rains, which fell on
already saturated ground caused by Tropical Storm Bonnie and
Hurricane Frances that traversed much of the same area in August
and early September.
An outbreak of 117 tornadoes -- with the bulk of the tornadoes on 17 September -- developed over
a 3 day period in the United States, including 37 in Virginia, 25 in Georgia, 18 in Florida, 9
in Pennsylvania, 8 in Alabama, 7 in South Carolina, 6 in Maryland, 4 in North Carolina, and 3 in
West Virginia. There were 26 tornadoes reported on 15 September, 32 tornadoes
on 16 September, 57 tornadoes on 17 September, and 2 tornadoes (in Maryland) on 18 September. At
least 8 people were killed and 17 injured by the tornadoes. On 15 September, some of the more
significant tornado events occurred -- an F2 tornado occurred near Panama City Beach (Bay Co.),
FL resulting in 1 death and 7 injuries; a second F2 tornado occurred near Blountstown (Calhoun Co.),
FL resulting in 4 deaths and 1 injury; a third tornado (intensity undetermined) killed 2 people in
Panama City, FL a little more than 1 h after the F2 tornado had struck the area.
Storm surge of 10-15 ft occurred along the
coasts from Destin in the Florida panhandle westward to Mobile
Bay/Baldwin County, Alabama. Storm surge values of 6-9 ft were
observed from Destin eastward to St. Marks in the Florida Big Bend
region. Lesser values of storm surge continued east and southward
along the Florida west coast with 3.5 ft reported in Hillsborough
Bay/Tampa Bay. There was also a possible record observed wave
height of 52.5 ft reported by the NOAA Buoy 42040 located in the
north central Gulf of Mexico south of Alabama. In addition, severe
storm surge flooding of 8-10 ft with 20-30 ft waves caused more
than 5-8 ft of water to cover Grand Cayman Island at times. This
resulted in the airport and numerous homes being completely
inundated by sea water.
c. Casualty and Damage Statistics
The forces of Ivan were directly
responsible for 92 deaths - 39 in Grenada, 25 in United States, 17
in Jamaica, 4 in Dominican Republic, 3 in Venezuela, 2 in Cayman
Islands, and 1 each in Tobago and Barbados. Concerning the deaths
in the United States, 14 occurred in Florida, 8 in North Carolina,
2 in Georgia, and 1 in Mississippi. The breakdown of U.S. deaths by
cause is as follows: tornado (7), storm surge (5), fresh water
floods (4), mud slides (4), wind (3), and surf (2). Ivan was also
indirectly responsible for 32 deaths in the United States.
Ivan caused extensive damage to coastal and inland
areas of the United States. Portions of the Interstate 10 bridge
system across Pensacola Bay, Florida were severely damaged in
several locations as a result of severe wave action on top of the
10-15 ft storm surge. As much as a
quarter-mile of the bridge collapsed into the bay. The U.S Highway
90 Causeway across the northern part of the bay was also heavily
damaged. To the south of Pensacola, Florida, Perdido Key bore the
brunt of Ivan's fury and was essentially leveled. Along the Alabama
coast, high surf and wind caused extensive damage to Innerarity
Point and Orange
Beach. In the Alabama and Florida panhandle
areas, widespread over wash occurred along much of the coastal
highway system. In addition, extensive beach erosion caused severe
damage to or the destruction of numerous beachfront homes, as well
as apartment and condominium buildings. Some buildings collapsed
due to scouring of the sand from underneath the foundations caused
by the inundating wave action. Thousands of homes the three-county
coastal area of Baldwin, Escambia, and Santa Rosa were damaged or
destroyed. Cleanup efforts alone in Escambia County resulted in
debris piles that were more than three-quarters of a mile long and
70 feet high. In all, Ivan was the most destructive hurricane to
affect this area in more than 100 years. Strong winds also spread
well inland damaging homes, and downing tress and power lines. At
one point, more than 1.8 million people were without power in nine
states.
In addition to the damaged homes and businesses,
Ivan also destroyed millions of acres of woodlands and forests. The
Alabama Forestry Commission found damaged timber valued at about
$610 million on 2.7 million acres. These figures include
- Pine pulpwood: 7.5 million cubic feet
- Hardwood pulpwood: 2.6 million cubic feet
- Pine sawtimber: 351.5 million board feet
- Hardwood sawtimber: 493 million board feet.
In the 200,000-acre Blackwater Forest, just
east of Pensacola in the western Florida panhandle, more than 1.5
million board feet of timber were downed across 185,000 acres.
Ivan's effects were not just limited to
coastal and inland areas. Offshore oil industry operations in the
Gulf of Mexico were severely disrupted, and several oil drilling
platforms and pipelines sustained varying degrees of damage. The
normal daily flow of 475,000 barrels of oil and 1.8 billion cubic
feet of natural gas, plus refining operations, were disrupted for
more than 4 weeks. A total of 12 large pipelines and 6 drilling
platforms sustained major damage; another 7 platforms were
completely destroyed.
A total of 686,700 claims were filed and
the American Insurance Services Group estimates (14 December 2004
re-survey) that insured losses in the United States from Hurricane
Ivan totaled $7.11 billion, of which more than $4 billion occurred
in Florida alone. Using a two-to-one ratio of insured damages
yields an estimated U.S. loss of approximately $14.2 billion. In
addition to the insured losses that occurred, the U.S. Naval Air
Station at Pensacola, Florida sustained damage losses of $800-$900
million.
In the Caribbean region, extensive damage
occurred to homes, buildings and other structures. The following
are brief synopses of the reports received from some of the
Caribbean islands:
- Barbados
-
More than 176 homes completely
destroyed; many homes lost their roofs;
most coastal roads severely damaged due to
erosion caused by the storm surge and wave action.
- Cayman
- 95 percent of the homes and other buildings (which
generally follow South Florida's building codes) were damaged or
destroyed.
- Cuba
- Roofs were torn off homes in extreme western Pinar del Rio
Province; flooding damaged houses, and fishing and farm installations; mud
slides cut off at least two towns.
- Grenada
- At least 80 percent of the 100,000 residents were without
power; more than 14,000 homes were damaged or destroyed; 80 percent of the
nutmeg trees were destroyed; a 17th century prison was also
damaged allowing many of the inmates to briefly escape during the height of
the storm; Ivan was the worst hurricane to strike the island since Hurricane
Janet in 1955.
- Jamaica
- At least 47,000 homes were damaged, of which 5,600 were
completely destroyed; most of the islands utilities were damaged.
- St. Vincent/Grenadines
- 50 homes severely damaged with 2 homes washed away into the
sea; more than two-thirds of residents lost power.
- Tobago
- At least 1 home collapsed and fell into the ocean; at least
45 homes lost their roofs; numerous trees and utility were blown down; 20
villages suffered various forms of damage
In the Caribbean Sea region, the Caribbean
Development Bank (CDB) estimates the damage at more than US$3
billion -- US$1.85 billion in the Cayman Islands, US$815 million in
Grenada, US$360 million in Jamaica, US$40 million in St. Vincent
and the Grenadines, and US$2.6 million in St Lucia. No damage
estimates were available from any of the other Windward Islands
countries, Venezuela, or Cuba.
d. Forecast and Warning Critique
Average official track errors (with the
number of cases in parentheses) for Ivan were 24 (63), 47 (61), 79
(59), 108 (56), 161 (52), 222 (48), and 289 (44) n mi for the 12,
24, 36, 48, 72, 96, and 120 h forecasts, respectively. In
comparison, the longer-term average official track errors for the
10-yr period 1994-2003[1] are 44, 78, 112, 146, 217, 248,
and 319 n mi. Table 6 contains the average errors from various
numerical track forecast models for Ivan. The average NHC official
track forecast (OFCL) errors for Ivan were better than the 10-yr
average throughout the 120 h forecast cycle, especially through 72
h. However, most of the various numerical track forecast models,
like the UKMET and FSU Superensemble (FSSE) models outperformed the
NHC official track forecast at most times. On average, the FSSE
model significantly outperformed the NHC official forecast at all
times. Average official intensity errors were 9, 12, 13, 12, 15, 24
and 36 kt for the 12, 24, 36, 48, 72, 96, and 120 h forecasts,
respectively. For comparison, the average official intensity errors
over the 10-yr period 1994-2003 are 6, 10, 12, 15, 19, 20, and 21
kt, respectively. These intensity errors were greater than average
at 96 and 120 h due to rapid intensification and greater than
forecast intensities that occurred over the Caribbean Sea.
Synoptic-scale analyses produced by the NOAA Global Forecast System
(GFS) indicate that Ivan essentially remained underneath a 200 mb
ridge axis as the hurricane traversed the Caribbean Sea. This
resulted in implied relatively low 850-200 mb vertical wind shear
values ( < 10 kt in many times periods) over the inner
core region and also provided favorable upper-level outflow
channels to the north and south. However, the Statistical Hurricane
Intensity Prediction Scheme (SHIPS) model failed to capture both
the early rapid intensification period and the lengthy period of
category 4 and 5 strength. This may be due to the way the SHIPS
model assesses the vertical shear across a tropical cyclone. During
the period 7-14 September when significant intensification
occurred, the SHIPS model assessed the vertical shear on numerous
occasions to be 15-20 kt from a westerly direction. Typically when
alleged westerly shear of this magnitude is present, little or no
strengthening occurs and, more often, weakening transpires. The
westerly vertical shear calculated by the SHIPS model may have been
due, in part, to its inability to separate the strong upper-level
outflow from the environmental flow in which the cyclone was
embedded.
Official track forecasts had, in general, a
persistent right-of-track bias for the first 11 days of Ivan's
existence as a tropical cyclone (Figure 5a). The official track
forecasts relied heavily on the global model forecasts, which
prematurely eroded the large and strong subtropical ridge to the
north of Ivan that extended well westward across the Bahamas,
Florida, and into the Gulf of Mexico. In fact, several of the GFS
model forecast cycles consistently eroded the ridge across Bahamas
and took Ivan well to the east of Florida, even as the hurricane
was approaching Jamaica. The westward jog that Ivan made on 11
September appears to be, at least in part, the result of a mid- to
upper-level cold low to the north of Hispaniola that moved slowly
southwestward rather than weakening and lifting out to the
northeast as some of the models had been forecasting. Despite the
early right bias, once Ivan moved into the northwestern Caribbean
Sea, the track forecasts gradually narrowed down the likely
landfall region of the western Florida panhandle and Alabama coasts
(Figure 5b). Table 7 lists all of the watches
and warnings issued for Ivan.
A hurricane watch was issued for the
central U.S. Gulf coast more than 51 h prior to landfall on the
Alabama coast. A hurricane warning was issued for the same area
less than 42 h prior to landfall. Over the 72 h period leading up
to the first U.S. landfall, there was a spread of only 95 n mi
between the westernmost and easternmost forecast tracks. In fact,
more than 75% of those forecasts targeted the Alabama coast as the
most likely area where landfall was expected to occur. The result
of these forecasts was that Ivan made landfall well within the area
covered by the hurricane watch and warning.
Acknowledgments
NWS/WFOs Houston/Galveston, Huntsville,
Jacksonville, Key West, Lake Charles, Mobile, New Orleans
(Slidell), Tallahassee, and Tampa Bay, and the NOAA
Hydrometeorological Prediction Center and the NOAA Southeast River
Forecast Center contributed many of the observations contained in
this report. Amateur Radio (HAM) operators throughout the Caribbean
region and those working as part of the National Hurricane Center's
WX4NHC Hurricane WatchNet team (
http://www.fiu.edu/orgs/w4ehw/)
were indispensable in providing critical reports as Ivan moved
through the Windward Islands and across the Caribbean Sea.
[1]Errors given
for the 96 and 120 h periods are averages over the three-year
period 2001-3.
Table 1: Best track for Hurricane Ivan,
2-24 September 2004.
Date/Time
(UTC) | Position | Pressure
(mb) | Wind Speed
(kt) | Stage |
Lat.
(°N) | Lon.
(°W) |
| 02 / 1800 | 9.7 | 27.6 | 1009 | 25 | tropical depression |
| 03 / 0000 | 9.7 | 28.7 | 1007 | 30 | " |
| 03 / 0600 | 9.7 | 30.3 | 1005 | 35 | tropical storm |
| 03 / 1200 | 9.5 | 32.1 | 1003 | 40 | " |
| 03 / 1800 | 9.3 | 33.6 | 1000 | 45 | " |
| 04 / 0000 | 9.1 | 35.0 | 999 | 45 | " |
| 04 / 0600 | 8.9 | 36.5 | 997 | 50 | " |
| 04 / 1200 | 8.9 | 38.2 | 997 | 50 | " |
| 04 / 1800 | 9.0 | 39.9 | 994 | 55 | " |
| 05 / 0000 | 9.3 | 41.4 | 991 | 60 | " |
| 05 / 0600 | 9.5 | 43.4 | 987 | 65 | hurricane |
| 05 / 1200 | 9.8 | 45.1 | 977 | 85 | " |
| 05 / 1800 | 10.2 | 46.8 | 955 | 110 | " |
| 06 / 0000 | 10.6 | 48.5 | 948 | 115 | " |
| 06 / 0600 | 10.8 | 50.5 | 950 | 110 | " |
| 06 / 1200 | 11.0 | 52.5 | 955 | 110 | " |
| 06 / 1800 | 11.3 | 54.4 | 969 | 90 | " |
| 07 / 0000 | 11.2 | 56.1 | 964 | 90 | " |
| 07 / 0600 | 11.3 | 57.8 | 965 | 95 | " |
| 07 / 1200 | 11.6 | 59.4 | 963 | 100 | " |
| 07 / 1800 | 11.8 | 61.1 | 956 | 105 | " |
| 08 / 0000 | 12.0 | 62.6 | 950 | 115 | " |
| 08 / 0600 | 12.3 | 64.1 | 946 | 120 | " |
| 08 / 1200 | 12.6 | 65.5 | 955 | 120 | " |
| 08 / 1800 | 13.0 | 67.0 | 950 | 120 | " |
| 09 / 0000 | 13.3 | 68.3 | 938 | 130 | " |
| 09 / 0600 | 13.7 | 69.5 | 925 | 140 | " |
| 09 / 1200 | 14.2 | 70.8 | 919 | 140 | " |
| 09 / 1800 | 14.7 | 71.9 | 921 | 130 | " |
| 10 / 0000 | 15.2 | 72.8 | 923 | 130 | " |
| 10 / 0600 | 15.7 | 73.8 | 930 | 125 | " |
| 10 / 1200 | 16.2 | 74.7 | 934 | 125 | " |
| 10 / 1800 | 16.8 | 75.8 | 940 | 120 | " |
| 11 / 0000 | 17.3 | 76.5 | 926 | 135 | " |
| 11 / 0600 | 17.4 | 77.6 | 923 | 130 | " |
| 11 / 1200 | 17.7 | 78.4 | 925 | 125 | " |
| 11 / 1800 | 18.0 | 79.0 | 920 | 145 | " |
| 12 / 0000 | 18.2 | 79.6 | 910 | 145 | " |
| 12 / 0600 | 18.4 | 80.4 | 915 | 135 | " |
| 12 / 1200 | 18.8 | 81.2 | 919 | 135 | " |
| 12 / 1800 | 19.1 | 82.1 | 920 | 130 | " |
| 13 / 0000 | 19.5 | 82.8 | 916 | 140 | " |
| 13 / 0600 | 19.9 | 83.5 | 920 | 140 | " |
| 13 / 1200 | 20.4 | 84.1 | 915 | 140 | " |
| 13 / 1800 | 20.9 | 84.7 | 912 | 140 | " |
| 14 / 0000 | 21.6 | 85.1 | 914 | 140 | " |
| 14 / 0600 | 22.4 | 85.6 | 924 | 140 | " |
| 14 / 1200 | 23.0 | 86.0 | 930 | 125 | " |
| 14 / 1800 | 23.7 | 86.5 | 931 | 120 | " |
| 15 / 0000 | 24.7 | 87.0 | 928 | 120 | " |
| 15 / 0600 | 25.6 | 87.4 | 935 | 120 | " |
| 15 / 1200 | 26.7 | 87.9 | 939 | 115 | " |
| 15 / 1800 | 27.9 | 88.2 | 937 | 115 | " |
| 16 / 0000 | 28.9 | 88.2 | 931 | 110 | " |
| 16 / 0600 | 30.0 | 87.9 | 943 | 105 | " |
| 16 / 1200 | 31.4 | 87.7 | 965 | 70 | " |
| 16 / 1800 | 32.5 | 87.4 | 975 | 50 | tropical storm |
| 17 / 0000 | 33.8 | 86.5 | 986 | 30 | tropical depression |
| 17 / 0600 | 34.7 | 85.7 | 991 | 25 | " |
| 17 / 1200 | 35.4 | 84.0 | 994 | 20 | " |
| 17 / 1800 | 36.2 | 82.3 | 996 | 20 | " |
| 18 / 0000 | 37.0 | 80.5 | 999 | 20 | " |
| 18 / 0600 | 37.7 | 78.5 | 998 | 15 | " |
| 18 / 1200 | 38.4 | 76.7 | 1000 | 15 | " |
| 18 / 1800 | 38.0 | 75.5 | 1002 | 25 | extratropical |
| 19 / 0000 | 37.5 | 74.0 | 1003 | 35 | " |
| 19 / 0600 | 36.0 | 74.0 | 1005 | 35 | " |
| 19 / 1200 | 34.5 | 74.5 | 1008 | 35 | " |
| 19 / 1800 | 32.8 | 75.8 | 1008 | 35 | " |
| 20 / 0000 | 31.0 | 77.5 | 1008 | 35 | " |
| 20 / 0600 | 29.0 | 78.5 | 1008 | 35 | " |
| 20 / 1200 | 27.5 | 78.7 | 1009 | 30 | " |
| 20 / 1800 | 26.4 | 79.1 | 1009 | 25 | " |
| 21 / 0000 | 26.1 | 79.7 | 1009 | 25 | " |
| 21 / 0600 | 25.9 | 80.6 | 1009 | 25 | " |
| 21 / 1200 | 25.8 | 81.7 | 1009 | 25 | " |
| 21 / 1800 | 25.2 | 82.8 | 1010 | 25 | low |
| 22 / 0000 | 24.8 | 84.1 | 1010 | 25 | " |
| 22 / 0600 | 25.1 | 86.1 | 1010 | 25 | " |
| 22 / 1200 | 26.0 | 87.3 | 1010 | 25 | " |
| 22 / 1800 | 26.5 | 88.6 | 1008 | 30 | tropical depression |
| 23 / 0000 | 27.1 | 89.5 | 1007 | 35 | tropical storm |
| 23 / 0600 | 27.9 | 91.0 | 1007 | 35 | " |
| 23 / 1200 | 28.9 | 92.2 | 998 | 50 | " |
| 23 / 1800 | 29.2 | 92.7 | 1003 | 40 | " |
| 24 / 0000 | 29.6 | 93.2 | 1003 | 30 | tropical depression |
| 24 / 0600 | 30.1 | 94.2 | 1009 | 25 | " |
| 24 / 1200 | | | | | dissipated inland |
| 12 / 0000 | 18.2 | 79.6 | 910 | 145 | minimum pressure |
| 13 / 2100 | 21.2 | 84.8 | 910 | 140 | minimum pressure |
| 07 / 2130 | 11.9 | 61.8 | 952 | 110 | closest point of approach, 6 n mi
south-southwest of Prickly Point, Grenada |
| 11 / 0330 | 17.4 | 77.2 | 924 | 130 | closest point of approach, 20 n mi south
of Portland Point, Jamaica |
| 12 / 1415 | 18.9 | 81.5 | 920 | 130 | closest point of approach, 22 n mi
south-southwest of Georgetown, GCI |
| 14 / 0100 | 21.7 | 85.2 | 916 | 140 | closest point of approach, 15 n mi
southwest of Cabo San Antonio, Cuba |
| 16 / 0650 | 30.2 | 87.9 | 946 | 105 | 1st U.S.
landfall near Pine Beach, AL, or 9 n mi west-southwest
of Gulf Shores, AL |
| 24 / 0200 | 29.8 | 83.6 | 1004 | 30 | 2nd U.S.
landfall near Holly Beach, LA, or 10 n mi west of Cameron,
LA |
Table 2: Selected ship and drifting buoy
reports with winds of at least 34 kt for Hurricane Ivan,
2-24 September 2004.
| Ship Name or Call Sign | Date/Time (UTC) | Lat.
(°N) | Lon.
(°W) | Wind dir/speed (deg/kt) | Pressure (mb) |
| 13009 | 04 / 1100 | 8.0 | 38.0 | - - - / 36 | - - - |
| MV Son Monoy | 08 / 0359 | 10.7 | 66.2 | 320 / 40G50 | - - - |
| ZCDE4 | 08 / 1200 | 11.6 | 62.7 | 120 / 47 | 1007.2 |
| WDA406 | 11 / 0600 | 15.9 | 77.5 | 230 / 37 | 1002.1 |
| ATPN | 12 / 0400 | 16.8 | 80.2 | 010 / 46 | 1005.0 |
| P3JA8 | 12 / 1500 | 17.7 | 81.8 | 250 / 53 | 997.5 |
| A8CO2 | 13 / 1800 | 18.3 | 85.5 | 260 / 35 | 1006.8 |
| A8CO2 | 13 / 2100 | 18.3 | 84.9 | 250 / 35 | 1005.9 |
| C6DM2 | 14 / 0000 | 17.9 | 86.8 | 280 / 44 | 1002.0 |
| LAZK4 | 14 / 1000 | 22.6 | 88.8 | 020 / 44 | 999.0 |
| WPPO | 14 / 1400 | 25.5 | 84.2 | 090 / 45 | 1004.0 |
| HZRX | 14 / 1500 | 24.5 | 83.3 | 110 / 52 | 1004.3 |
| WPPO | 14 / 1700 | 25.3 | 83.9 | 120 / 47 | 1004.0 |
| HZRX | 14 / 1800 | 24.1 | 82.7 | 120 / 52 | 1004.4 |
| WPPO | 14 / 2300 | 24.7 | 83.4 | 140 / 52 | 1004.2 |
| H3SM | 15 / 0900 | 27.1 | 90.2 | 020 / 39 | 999.7 |
| LANT5 | 15 / 1200 | 24.2 | 85.1 | 180 / 43 | 1005.0 |
| H3SM | 15 / 1500 | 27.0 | 90.0 | 360 / 50 | 963.0 |
| H3SM | 15 / 1800 | 27.0 | 90.2 | 330 / 43 | 963.7 |
| SPLL1 | 15 / 1800 | 28.9 | 90.5 | 010 / 39 | 1002.2 |
| H3SM | 15 / 2100 | 27.0 | 90.2 | 320 / 46 | 998.0 |
| H3SM | 16 / 0000 | 27.0 | 90.2 | 290 / 42 | 1001.3 |
| C6YC | 19 / 0600 | 37.5 | 74.5 | 010 / 37 | 1010.5 |
| DHBN | 19 / 1200 | 40.4 | 70.7 | 020 / 35 | 1016.0 |
| A8CF2 | 20 / 0600 | 34.7 | 72.3 | 020 / 37 | 1017.0 |
| VRXL6 | 20 / 0600 | 33.4 | 73.0 | 200 / 35 | 1015.5 |
| WGXO | 20 / 0600 | 29.5 | 79.6 | 040 / 37 | 1011.0 |
|
Table 3: Selected surface observations for
Hurricane Ivan, 2-24 September 2004.
| | Minimum
Sea-level
Pressure | Maximum Surface Wind Speed
(kt) | |
| Location | Date/
Time
(UTC) | Press.
(mb) | Date/
Timea
(UTC) | Sust.
Windb
(kts) | Peak
Gust (kts) | Storm
Surgec
(ft) | Storm
Tided
(ft) | Rain
(storm total)
(in) |
| Windward Islands |
| Dominica |
| Hewanorra (TLPL) | | | 07/1700+ | 37 | | | | |
| Grenada |
| Point Salines
(TGPY) | | | 07/2000 | 45 | 81 | | | |
| | | 07/2100 | 64 | 101 | | | |
| | | 07/2300 | 49 | 67 | | | |
| Jamaica |
| Craighead | | | | | | | | 26.83 |
| Kingston (MKJP) | 11/0129 | 991.5 | 11/0217* | 55 | | | | |
| Mavis Bank | | | | | | | | 27.92 |
| Negril Point | 11/???? | 986.8 | | | | | | |
| Pedro Bank | 11/???? | 979.5 | 11/???? | 116 | | | | |
| Ritchies | | | | | | | | 28.37 |
| Rose Hill | | | | | | | | 25.80 |
| South Central coastal areas | | | | | | 4-6 | | |
| Worthy Park | | | | | | | | 26.83 |
| Cayman Islands |
| Cayman Brac | 12/0300 | 997.0 | 12/0200 | 44 | 58 | | | 4.92 |
| Grand Cayman | 12/1345 | 970.0 | 12/1500 | 130 | 149 | 8-10 | | 12.14 |
| Cuba |
| Cabo de San
Antonio | | | 14/0050# | 96 | 104 | | | |
| Cuba - Francia (78309) | 14/0000 | 1001.6 | 14/0043 | 45 | 56 | | | 10.16 |
| La Fe
(78321) | 13/1850 | 1001.0 | 13/1248 | 51 | 64 | | | 6.26 |
| La Palma (78316) | 14/0100 | 1000.3 | 14/0620 | 49 | 61 | | | 4.43 |
| Isabel Rubio
(78313) | 14/0200 | 990.1 | 14/0200 | 61 | 76 | | | 13.33 |
| Nueva Gerona (Isle of
Youth) | 13/1800 | 1000.1 | 13/1457 | 55 | 69 | | | 5.66 |
| Pinar del Rio
(78315) | 13/2310 | 997.7 | 14/0140 | 54 | 67 | | | 7.69 |
| Pinar del Rio Prov. (s.
coast) | | | | | | 6-12 | | |
| P.R.S. Diego
(78317) | 13/2340 | 1001.5 | 14/0140 | 42 | 52 | | | 5.55 |
| Punta del Este
(78324) | 13/2200 | 1000.7 | 14/0030 | 49 | 61 | | | 4.75 |
| San Juan y Martinez
(78314) | 14/0100 | 996.0 | 13/2340 | 47 | 59 | | | 5.69 |
| Santa Lucia
(78312) | 14/0200 | 994.7 | 14/0220 | 61 | 76 | | | 6.00 |
| Alabama |
| Alabaster
(KEET) | 17/0053 | 991.7 | | | | | | 6.00 |
| Alberta | | | | | | | | 6.85 |
| Alexander City (KALX) | | | 16/1500 | | 36 | | | |
| Andalusia (HAM Radio) | | | | | | | | 9.96 |
| Anniston (ANNA1) | | | | | | | | 7.64 |
| Anniston (KANB) | 17/0053 | 991.5 | | | | | | |
| Ariton Co-op
(ARTA1) | | | | | | | | 5.32 |
| Baldwin County | | | | | | 10-15 | | |
| Bellwood Co-op (BELA1) | | | | | | | | 5.48 |
| Bessie | | | | | | | | 5.81 |
| Birmingham (KBHM) | 17/0053 | 989.6 | 16/1653 | | 42 | | | 9.81 |
| Blakely (Co-op
(BLKG1) | | | | | | | | 6.50 |
| Blount
Springs | | | | | | | | 5.29 |
| Brookley / Mobile
(KBFM) | 16/0656 | 956.0 | | | | | | |
| Coden | | | | | | | | 6.30 |
| Cullman
(K3A1) | | | 16/1740+ | | 39 | | | |
| Daleville Co-op
(DALA1) | | | | | | | | 5.82 |
| Daphne | | | | | | | | 7.50 |
| Dothan (KDHN) | 16/0752 | 1000.6 | 16/1900 | 38 | 47 | | | 5.94 |
| Elba Co-op (EBBA1) | | | | | | | | 5.48 |
| Evergreen
(EVRA1) | | | | | | | | 7.55 |
| Fairhope
(awis) | | | 16/0418 | | 63 | | | |
| Flat Rock
(FLRA1) | | | | | | | | 8.04 |
| Florence (C0168) | | | 17/0050+ | | 37 | | | |
| Fort Payne 6NE
(LRWA1) | | | | | | | | 7.30 |
| Fort Payne (K4A9) | | | 16/1920 | | 45 | | | |
| Gadsden
(KGAD) | | | 16/1735 | | 37 | | | |
| Geneva Co-op (GVAA1) | | | | | | | | 8.20 |
| Grand Bay (awis) | | | 16/0517 | | 62 | | | |
| Helena | | | | | | | | 4.72 |
| Huntsville (KHSV) | 16/2353 | 994.3 | 16/2153 | | 40 | | | |
| Huntsville (KMDQ) | | | 16/2242+ | | 35 | | | |
| Jackson Shoals | | | | | | | | 4.05 |
| Ketona | | | | | | | | 9.69 |
| Lauderdale
(RLDM6) | | | 16/1113 | | 47 | | | |
| Lower Bryant Landing
(NOS) | | | | | | 3.4 | | |
| Manchester | | | | | | | | 4.35 |
| Maxwell AFB
(KMXF) | 16/1755 | 989.9 | 16/1257 | 31 | 57 | | | 9.78 |
| Millers Ferry
(MRFA1) | | | | | | | | 11.66 |
| Mobile (KMOB) | 16/0725 | 964.4 | 16/0644 | 51 | 65 | | | 5.56 |
| Mobile (2S KMOB) | | | | | | | | 9.90 |
| Mobile (3S KMOB) | | | | | | | | 6.30 |
| Mobile (7S KMOB) | | | | | | | | 6.53 |
| Mobile (10S KMOB) | | | | | | | | 8.00 |
| Mobile County | | | | | | 6-9 | | |
| Montgomery
(KMGM) | 16/1753 | 989.5 | 16/1353 | 32 | 50 | | | |
| Muscle Shoals
(KMSL) | 16/2253 | 998.7 | 16/2110 | | 40 | | | |
| Newton Co-op (NEWA1) | | | | | | | | 5.47 |
| Ozark / Ft. Rucker
(KOZR) | 16/1055 | 999.8 | 16/0955 | | 38 | | | 6.10 |
| Ram Powell VK-956 Oil
Rig - 400 ft elev. (29.05°N
88.10°W) | 15/2256* | 952.6 | 15/2256* | 102 | 135 | | | |
| Robertsdale | | | | | | | | 9.35 |
| Selma (SELA1) | | | | | | | | 8.87 |
| Semmes
(awis) | 16/0830 | 967.5 | 16/0500 | 49 | 51 | | | 5.00 |
| Silverhill
(3S) | | | | | | | | 10.16 |
| Spanish Fort | | | 16/0800 | | 51 | | | 8.00 |
| Talladega | | | | | | | | 5.60 |
| Tannehill | | | | | | | | 9.76 |
| Troy (KTOI) | 16/1755 | 994.7 | 16/1128+ | | 37 | | | |
| Trussville (TRSA1) | | | | | | | | 8.97 |
| Tuscaloosa (KTCL) | 16/1353 | 996.7 | 16/1453+ | | 43 | | | |
| Valley Head (VYHA1) | | | | | | | | 8.27 |
| Wing 6NE (OPNA1) | | | 16/1022+ | | 58 | | | |
| Wedowee | | | | | | | | 5.20 |
| Florida |
| Apalachicola (KAAF) | | | | | | | | 4.11 |
| Baker
(BAKF1) | | | | | | | | 10.41 |
| Bay County | | | | | | 8-10 | | |
| Big Pine Key | | | | | | | | 2.12 |
| Bristol Co-op (BRLF1) | | | | | | | | 7.00 |
| Bruce Co-op
(BRUF1) | | | | | | | | 7.05 |
| Chipley Co-op
(CHPF1) | | | | | | | | 5.42 |
| Crestview
(CRVF1) | | | | | | | | 7.68 |
| Crestview (HAM
radio) | | | | | | | | 8.40 |
| Cross City
(KCTY) | | | 16/1918 | | 31 | | | |
| Dixie County | | | | | | 4 | | |
| Eglin AFB
(KVPS) | 16/0755 | 991.6 | 16/0755 | 46 | 70 | | | 7.43 |
| Escambia County | | | | | | 10-15 | | |
| Franklin County | | | | | | 3-5 | | |
| Ft. Walton (HAM radio) | | | | | | | | 6.06 |
| Gulf County (St. Joseph State
Park) | | | | | | 4-6 | | |
| Hillsborough Co.
(Hills. Bay) | | | | | | 3.5 | | |
| Huntsville (KHSV) | | | | | | | | 3.73 |
| Jefferson County | | | | | | 4 | | |
| Key West (KEYW) | | | 14/0903 | 36 | 46 | | | 1.11 |
| Key West (KEYW - Atlantic) | | | | | | 1.0 | | |
| Levy County (Cedar
Key) | | | | | | 1.91 | | |
| Lowry Mill Co-op
(LOWA1) | | | | | | | | 7.33 |
| Marianna Co-op
(MALF1) | | | | | | | | 5.28 |
| Mayport Naval Stn.
(KNRB) | | | 21/0355+ | | 34 | | | |
| Milligan
(MLGF1) | | | | | | | | 11.31 |
| Mossy Head Co-op
(MHDF1) | | | | | | | | 9.26 |
| Munson | | | | | | | | 6.50 |
| Nettles Island (NETF1) | | | | | | | | 7.62 |
| Niceville | | | | | | | | 6.55 |
| Okaloosa County | | | | | | 6-9 | | |
| Panama City (KPFN) | 16/0853 | 999.9 | 16/1700 | 30 | 60 | | | |
| Pensacola (KPNS) | 16/0645 | 970.2 | 16/0650 | 67 | 87 | | | |
| Pensacola NAS (KNPA) | 16/0656 | 965.8 | 16/0629 | 76 | 93 | | | 8.00 |
| Pensacola (WEAR-TV) | | | | | | | | 15.79 |
| Perry (K40J) | | | 16/1749 | | 41 | | | |
| Saint Augustine (KSGJ) | | | 21/0300 | | 36 | | | |
| Santa Rosa County | | | | | | 10-15 | | |
| Sarasota (KSRQ) | | | 16/1255 | | 30 | | | |
| Seminole 5NE | | | | | | | | 8.10 |
| Tallahassee (KTLH) | | | 16/1605 | 33 | 47 | | | |
| Taylor County | | | | | | 4 | | |
| Walton County | | | | | | 8-10 | | |
| Wakulla County | | | | | | 4-5 | | |
| Georgia |
| Albany (KABY) | | | 16/1803 | | 36 | | | |
| Athens (KAHN) | | | 16/2333 | | 39 | | | |
| Atlanta - Falcon
(KFFC) | | | 17/0122 | | 34 | | | |
| Atlanta - Hatrsfield
(KATL) | | | 16/2357 | | 39 | | | |
| Atlanta - McCollum
(KRYY) | | | 16/2347 | | 35 | | | |
| Atlanta - Peachtree
(KPDK) | | | 16/2125 | | 38 | | | |
| Byromville
(BYRG1) | | | 16/2105 | | 34 | | | |
| Canton / Cherokee Co.
(K47A) | | | 16/2122 | | 35 | | | |
| Chickamauga (FTOG1) | | | | | | | | 7.75 |
| Clayton 4NE
(TULG1) | | | 18/0206 | | 43 | | | |
| Clayton 10W
(TCLG1) | | | | | | | | 7.87 |
| Columbus
(KCSG) | 16/2151 | 997.1 | 16/2227+ | | 39 | | | |
| Elberton
(K27A) | | | 17/0101 | | 37 | | | |
| Ellijay 7NW
(MTNG1) | | | | | | | | 7.24 |
| Fort Benning AAF
(KLSF) | | | 16/2355 | | 36 | | | |
| Gainesville (KGVL) | | | 16/2253 | | 39 | | | |
| Helen
(HELG1) | | | | | | | | 8.57 |
| Helen 7N
(BRSG1) | | | 17/0306 | | 61 | | | |
| Hurst 3SE (HSTG1) | | | | | | | | 8.42 |
| Lafayette 5SW (LFYG1) | | | | | | | | 7.28 |
| Lagrange
(KLGC) | | | 16/2140 | | 34 | | | |
| Lawrenceville
(KLZU) | | | 16/2150 | | 40 | | | |
| Mountain City 2N
(MTCG1) | | | | | | | | 7.10 |
| Nacoochee
(NACG1) | | | | | | | | 9.20 |
| Pine Mountain (PIMG1) | | | | | | | | 7.80 |
| Preston Co-op (PRSG1) | | | | | | | | 5.57 |
| Rome (KRMG) | 17/0553 | 994.5 | | | | | | |
| Suches 6NW
(TCCG1) | | | 17/0005 | | 39 | | | |
| Tallula Falls (TLUG1) | | | | | | | | 7.88 |
| Thomaston - Upson
(KOPN) | | | 16/2101 | | 38 | | | |
| Titus
(TUSG1) | | | | | | | | 9.27 |
| Valdosta (KVLD) | | | 16/1907 | | 37 | | | |
| Washington 5NW (WSNG1) | | | 17/202 | | 35 | | | |
| Winder
(KWDR) | | | 16/2240 | | 39 | | | |
| Kentucky |
| Greenup
(GNUK2) | | | | | | | | 6.26 |
| Louisiana |
| Barataria Bay | | | 15/1700 | | 44 | | | |
| Bootheville
(KBVE) | | | 15/1551 | 31 | 42 | | | |
| Bootheville - LSU
Citrus AG | | | 16/0000 | | 52 | | | 1.05 |
| Buras | | | | | | | | 2.50 |
| Calcasieu Pass - East
Jetty | | | | | | 1.7 | | |
| Cameron Heliport
(K7R5) | | | 23/2325 | | 34 | | | |
| Cameron Prairie
NWR | | | | | | | | 4.14 |
| Cocodrie | | | 16/0000 | | 36 | | | |
| Deridder | | | | | | | | 3.00 |
| Elmer 2SW | | | | | | | | 3.75 |
| Franklin 3NW | | | | | | | | 3.04 |
| Hackberry 8SSW
(HAKL1) | | | 24/0140 | | 36 | | | |
| Galliano - Little
Lake | | | 15/2300 | | 41 | | | |
| Grand Isle - East
Point | | | | | | 1.7 | | |
| Laffitte - Lake
Salvador | | | 16/0300 | | 34 | | | |
| Lake Charles (KLCH) | 23/2346 | 1012.5 | 24/0217 | 23 | 30 | | | 1.16 |
| Lake Pontchartrain - Mandeville | | | 16/0030 | 30 | 33 | | | |
| Lake Pontchartrain - mid lake | | | 16/0330 | 35 | 46 | | | |
| Marco Polo GC608 Oil
Rig - 300 ft elev. (27.36°N 90.19°W) | | | 15/2100& | 54 | | | | |
| New Orleans (KNEW) | 16/0125 | 994.2 | 16/0206 | 41 | 48 | | | 0.08 |
| New Orleans (KMSY) | 16/0644 | 998.0 | 15/2138 | 33 | 40 | | | Trace |
| Pointe a la Hache - northeast Bay
Gardene | | | 16/0400 | | 60 | | | |
| Rockefeller NWR | | | | | | | | 3.22 |
| Slidell (KASD) | 16/0147 | 994.2 | 16/0011 | 32 | 37 | | | 0.26 |
| SW Pass
(NOS) | | | | | | 3.0 | | |
| Maryland |
| AP259
APRSWXNET (39.0°N
76.3°W) | | | 18/1700 | | 36 | | | |
| Patuxent NAS
(KNHK) | | | 18/2355 | | 35 | | | |
| Mississippi |
| Biloxi Bay - NOAA/NOS | | | | | | 3.2 | | |
| Biloxi Harbor - Pointe Cadet | | | 16/0245 | 47 | 68 | | | |
| Columbus (KGTR) | | | 16/1815+ | | 46 | | | |
| Columbus AFB (KCBM) | 16/1955 | 995.8 | 16/1855 | | 35 | | | |
| Gautier - U.S. Hwy 90 | | | 16/0700* | | 51 | | | |
| Gholson 8W (GHLM6) | | | | | | | | 5.35 |
| Gulfport (KGPT) | 16/0703* | 983.7 | 16/0059* | 40 | 53 | | | 1.70 |
| Keesler AFB
(KBIX) | 16/0655 | 982.9 | 16/0644 | 42 | 62 | | | 3.28 |
| NAS Meridian
(KNMM) | 16/1555 | 992.0 | 16/1255 | 30 | 51 | | | |
| Ocean Springs - Ft.
Bayou | | | 16/0415 | | 43 | | | |
| Orange Grove -
Interstate 10 | | | 16/0715 | | 46 | | | |
| Pascagoula 3NNE | | | | | | | | 5.70 |
| Pascagoula / Jackson Co.
EOC (top of 2-story
building) | | | 16/0600 | | 76 | | | 6.29 |
| Pascagoula (KPQL) | 16/0536* | 975.6 | 15/2349* | 37 | 51 | | | 1.15 |
| Pass Christian - USCG Merril Shell
Bank Lighthouse | | | 16/0500 | | 64 | | | |
| Van Cleave (BCVM6) | | | | | | | | 3.73 |
| Waveland - NOAA/NOS | | | 16/0242 | 34 | 49 | 3.4 | | |
| Waveland - Hancock Co. EOC | | | 16/0430 | | 53 | | | |
| New Hampshire |
| Jaffrey (AFN) | | | | | | | | 7.30 |
| New Jersey |
| Columbia (CMBN4) | | | | | | | | 5.50 |
| New York |
| Deposit
(DEPN6) | | | | | | | | 5.37 |
| Fishs Eddy
(FSHN6) | | | | | | | | 5.40 |
| Stuyvesant 5N
(STYN6) | | | | | | | | 5.11 |
| Windham (WDMN6) | | | | | | | | 5.45 |
| North Carolina |
| Andrew - Murphy
(KRHP) | | | 17/0524 | | 39 | | | |
| AP341 RAWS (36.1°N
81.9°W) | | | 17/0330 | | 41 | | | |
| Asheville (KAVL) | | | 17/0535+ | | 42 | | | |
| Black Mtn
(MMTN7) | | | | | | | | 9.05 |
| Boone (KTNB) | | | 17/0801 | | 45 | | | |
| Burgaw 11E
(BKIN7) | | | 17/2213 | | 36 | | | |
| Burlington (KBUY) | | | 17/1727 | | 44 | | | |
| C1587 RAWS (35.8°N
78.9°W) | | | 17/1746 | | 39 | | | |
| Canton 10 SSW (SNBN7) | | | | | | | | 8.92 |
| Charlotte Int'l
(KCLT) | | | 17/0851 | | 35 | | | |
| Cruso | | | | | | | | 17.00 |
| Cullowhee
(CUWN7) | | | 17/0610+ | | 42 | | | |
| Daniel Ridge (DNRN7) | | | | | | | | 8.25 |
| Elizabeth City (KECG) | | | 18/0254 | | 36 | | | |
| Fayetteville 11WNW (FBRN7) | | | 17/2007+ | | 36 | | | |
| Fayetteville (KFAY) | | | 17/2023+ | | 41 | | | |
| Guion Farms AFS
(GUIN7) | | | 17/0610 | | 44 | | | |
| H0002 RAWS (36.4°N
81.5°W) | | | 17/0510 | | 37 | | | |
| Hawk - IFLOWS
(HAKN7) | | | | | | | | 7.12 |
| Highlands (C0930) | | | 17/0155 | | 41 | | | |
| Highlands - IFLOWS
(HILN7) | | | | | | | | 8.16 |
| Highlands (TVA) | | | | | | | | 11.83 |
| Hogback
(IHBN7) | | | | | | | | 8.92 |
| Jacksonville (KOAJ) | | | 17/1835 | | 35 | | | |
| Jefferson
(KGEV) | | | 18/0441+ | | 41 | | | |
| Jonas Ridge (JSRN7) | | | | | | | | 8.95 |
| Kill Devil
Hills (KFFA) | | | 19/0900 | | 38 | | | |
| Kure Beach 3W
(SUNN7) | | | 18/0058 | | 39 | | | |
| Laurel Springs (LRLN7) | | | 17/0810* | | 51 | | | |
| Mackall AAF
(KHFF) | | | 17/1555 | | 34 | | | |
| Manteo
(KMQI) | | | 18/1100+ | | 37 | | | |
| New
Bern (KEWN) | | | 18/0107+ | | 35 | | | |
| Plumtree
(PLMN7) | | | | | | | | 8.08 |
| Purlear 2N
(RVZN7) | | | 18/0810+ | | 42 | | | |
| Raleigh - Durham
(KRDU) | | | 17/1951 | | 36 | | | |
| Rich Mountain (RCMN7) | | | | | | | | 8.08 |
| Rosman 6E
(CFFN7) | | | | | | | | 7.83 |
| Shallotte 7NE
(NATN7) | | | 17/2259 | | 38 | | | |
| Shelby
(KEHO) | | | 17/0720 | | 35 | | | |
| Spruce Pine
3SE (SPPN7) | | | | | | | | 7.20 |
| TS156 RAWS
(35.8°N 82.7°W) | | | 17/0908 | | 42 | | | |
| Whiteville
(WHIN7) | | | 17/2045 | | 35 | | | |
| Yancey
(YNCN7) | | | | | | | | 7.50 |
| Ohio |
| Albany (ABNO1) | | | | | | | | 8.53 |
| Pennsylvania |
| Acmetonia
(ACMP1) | | | | | | | | 7.51 |
| Ansonville
(ANSP1) | | | | | | | | 7.29 |
| Blakeslee
(TBYP1) | | | | | | | | 8.20 |
| Cristy Manor 2SE
(CRCP1) | | | | | | | | 7.15 |
| Elimsport
(ELIP1) | | | | | | | | 7.60 |
| Fort Indiantown Gap
(FIGP1) | | | | | | | | 7.90 |
| Hugos Corners
(HGCP1) | | | | | | | | 7.40 |
| Loyalsockville
(LOYP1) | | | | | | | | 5.40 |
| Pine Grove 1SW
(PGVP1) | | | | | | | | 7.70 |
| Scrub Oak
(SCBP1) | | | | | | | | 8.32 |
| South Carolina |
| Anderson
(KAND) | | | 17/0040 | | 38 | | | |
| Greenville (KGMU) | | | 17/0253 | | 37 | | | |
| Greenwood (KGRD) | | | 17/0556 | | 34 | | | |
| Greer (KGSP) | | | 17/0303 | | 40 | | | |
| North Myrtle
Beach (KCRE) | | | 17/2208 | | 38 | | | |
| Tennessee |
| Crossville
(CSST1) | | | 17/0606 | | 34 | | | |
| Burns
(BURT1) | | | 17/0406+* | | 56 | | | |
| Charleston (CHTT1) | | | | | | | | 7.39 |
| Chattanooga (KCHA) | 17/0853 | 994.7 | | | | | | |
| Chickamauga Dam (CKDT1) | | | | | | | | 7.63 |
| Coker Creek
(CCKT1) | | | 17/06744+ | | 42 | | | |
| Dayton (DAYT1) | | | | | | | | 7.65 |
| Decatur
(DECT1) | | | | | | | | 7.86 |
| Lenoir City 5NW
(LCLT1) | | | 17/0505 | | 39 | | | |
| Lewisburg
(LSBT1) | | | 17/0106 | | 35 | | | |
| McDonald | | | | | | | | 11.03 |
| Morristown 3NNE (HCOT1) | | | 17/0505 | | 36 | | | |
| Pikeville 7NW
(BLDT1) | | | 17/0105 | | 41 | | | |
| Sweetwater
(SWET1) | | | | | | | | 8.99 |
| Watts Bardam (WBOT1) | | | | | | | | 7.52 |
| Whitwell 7SE
(PCFT1) | | | 16/2106 | | 51 | | | |
| Texas |
| Beaumont
(KBPT) | 24/0425 | 1008.8 | 24/0339 | 23 | 30 | | | 1.05 |
| Beckville
(BEKT2) | | | | | | | | 7.86 |
| Bon Weir | | | | | | | | 2.70 |
| Eagle Point - Galveston
Bay | | | | | | 1.7 | | |
| Galveston Pier 21 | | | | | | 1.6 | | |
| Houston Hobby (KHOU) | 23/2156 | 1012.9 | 23/2344 | | 23 | | | 0.62 |
| Jamaica Bch Co-op (JBHT2) | 23/2230 | 1012.7 | 22/0932 | | 29 | | | Trace |
| Matagorda Island (MIRT2) | | | 24/0512 | | 47 | | | |
| Sabine Pass
North | | | | | | 1.4 | | |
| Sam Rayburn
Reservoir | | | | | | | | 3.49 |
| Silsbee 4N | | | | | | | | 2.00 |
| Steinhagen Lake (TBLT2) | | | | | | | | 7.07 |
| Toledo Bend Reservoir | | | | | | | | 2.34 |
| Weches - Houston
Co. | | | | | | | | 1.92 |
| Virginia |
| Big Meadows
(BGMV2) | | | | | | | | 5.72 |
| Dulles / Wash. Int'l
(KIAD) | | | 17/2212+ | | 37 | | | |
| Hillsville
(KHLX) | | | 17/0900 | | 42 | | | |
| Hot Springs (KHSP) | | | 18/0500 | | 34 | | | |
| Langley AFB
(KLFI) | | | 19/0155 | | 36 | | | |
| Leesburg
(KJYO) | | | 18/1541 | | 36 | | | |
| Manassas (KHEF) | | | 18/1955 | | 38 | | | |
| Martinsville (KMTV) | | | 18/0520 | | 34 | | | |
| Meadows of Dan
(AP852) | | | 18/1815 | | 41 | | | |
| Melfa (KMFV) | | | 18/0420 | | 37 | | | |
| Norfolk Int'l (KORF) | | | 19/0351+ | | 35 | | | |
| Norfolk Naval Stn (KNGU) | | | 19/0755 | 30 | 38 | | | |
| Oceana NAS
(KNTU) | | | 18/2256 | | 37 | | | |
| Reagan / Wash. Int'l
(KDCA) | | | 18/2051+ | | 35 | | | |
| Richmond Int'l (KRIC) | | | 18/0012+ | | 35 | | | |
| Stafford (KRMN) | | | 18/1720 | | 37 | | | |
| Strasburg
(STGV2) | | | | | | | | 5.50 |
| TS121 RAWS (37.9°N
81.9°W) | | | 17/2214 | | 34 | | | |
| West Virginia |
| Buckhannon
(KW22) | | | 18/0200+ | | 42 | | | |
| Charleston (KCRW) | | | 17/2154 | | 32 | | | |
| Clarksburg (KCKB) | | | 18/0053+ | | 37 | | | |
| Gallipois Dam
(GALW2) | | | | | | | | 5.94 |
| Moundsville
(MOUW2) | | | | | | | | 7.68 |
dStorm tide is water height above National Geodetic Vertical Datum (1929 mean sea level).
aDate/time is for sustained
wind when both sustained and gust are listed.
bExcept as noted, sustained
wind averaging periods for C-MAN and land-based ASOS reports are 2
min; buoy averaging periods are 8 min.
cStorm surge is water height
above normal astronomical tide level.
dStorm tide is water height
above National Geodetic Vertical Datum (1929 mean sea level).
+Last of several occurrences
#Approximate time
*Instrument failed after report
&30-minute averaging period |
Table 4: Selected fixed buoy and C-MAN
observations for Hurricane Ivan, 2-24 September 2004.
| | Minimum
Sea-level
Pressure | Maximum Surface Wind Speed
(kt) | |
| Location | Date/
Time
(UTC) | Press.
(mb) | Date/
Timea
(UTC) | Sust.
Windb
(kts) | Peak
Gust (kts) | Storm
Surgec
(ft) | Storm
Tided
(ft) | Rain
(storm total)
(in) |
| C-MAN |
| BURL1 (28.9°N
89.4°W) | 15/2300 | 983.6 | 15/2310 | 72 | 87 | | | |
| | | 16/0000 | 69 | | | | |
| | | 15/2300 | 68 | | | | |
| 23/0500 | 1013.8 | 23/0300 | 35 | | | | |
| | | 23/0500 | 35 | | | | |
| CDRF1 (29.1°N
83.0°W) | | | 16/1217 | | 31 | | | |
| CLKN7 (34.6°N
76.5°W) | | | 18/0228 | | 34 | | | |
| CHLV2 (36.9°N
75.7°W) | 18/0400 | 1001.8 | 18/0350 | 38 | 48 | | | |
| | | 18/2230 | 39 | 45 | | | |
| | | 19/0500 | 39 | 45 | | | |
| DPIA1 (30.2°N
88.1°W) | 16/0705 | 952.7 | 16/0405 | 63 | 89 | | | |
| | | 16/0505 | 63 | | | | |
| DUCN7 (36.2°N
75.7°W) | | | 18/0330 | 33 | 47 | | | |
| 19/0300 | 1011.4 | 19/0400 | 38 | | | | |
| GDIL1 (29.3°N
90.0°W) | 16/0000 | 994.2 | 15/2310 | 46 | 61 | | | |
| | | 16/0200 | 43 | | | | |
| GLPT2 (29.3°N
94.8°W) | 23/2200 | 1012.2 | 22/0900 | | 32 | 1.6 | | |
| ILDL1 (29.0°N
90.5°W) | 23/0900 | 1013.7 | 23/0900 | 35 | | | | |
| MRSL1 (29.4°N
92.1°W) | 23/1200 | 1012.0 | 23/1200 | 32 | 38 | | | |
| SANF1 (24.5°N
81.9°W) | 13/1200 | 1010.9 | 13/1200 | 36 | 42 | | | |
| SAUF1 (29.9°N
81.3°W) | | | 20/0130 | 30 | 38 | | | |
| | | 20/1950 | 31 | 41 | | | |
| SGOF1 (29.4°N
84.9°W) | 15/2100 | 1005.2 | 15/2200 | 49 | 62 | | | |
| SHPF1 (30.1°N
84.3°W) | | | 16/1454 | | 31 | | | |
| SIPM6 (30.3°N
89.0°W) | 15/2300# | 997.4 | 15/2300# | 38 | | | | |
| SPLL1 (28.9°N
90.5°W) | 16/0200 | 999.6 | 16/0200 | 42 | | | | |
| 23/0700 | 1011.9 | 23/0700 | 36 | | | | |
| TPLM2 (38.9°N
76.4°W) | | | 18/0332 | | 35 | | | |
| | | 18/1740 | 34 | 41 | | | |
| TYBG1 (31.6°N
79.9°W) | 21/0726 | 1016.6 | 21/0726 | 35 | | | | |
| Buoys |
| 41012 (30.0°N
80.6°W) | | | 20/1750 | 29 | 39 | | | |
| 42001 (25.8°N
89.7°W) | 15/1050 | 995.2 | 15/0950 | 37 | | | | |
| 42003 (26.0°N
85.9°W) | 15/0750 | 993.5 | 15/0230 | 55 | 72 | | | |
| 42007 (30.1°N
88.8°W) | 16/0350# | 976.0 | 16/0350 | 49 | 68 | | | |
| | | 16/0530 | 49* | | | | |
| 42035 (29.3°N
94.4°W) | 23/2250 | 1012.2 | 16/0900 | | 30 | | | |
| 42036 (28.5°N
84.5°W) | | | 15/2020 | 34 | 49 | | | |
| 42039 (28.8°N
86.1°W) | 15/2350 | 995.1 | 15/2150 | 45 | 62 | | | |
| | | 15/2350 | 45 | | | | |
| 42040 (29.2°N
88.2°W) | 16/0150 | 955.3 | 15/2300 | 55 | 73 | | | |
| | | 16/0950 | 54 | | | | |
| 16/0050 | 956.3 | | | | | | |
| 42041 (27.5°N
90.5°W) | 15/1950 | 997.6 | 15/1950 | 35* | | | | |
| 44017 (40.7°N
72.0°W) | 18/1650 | 1006.9 | 18/1650 | 35 | | | | |
a Date/time is for sustained
wind when both sustained and gust are listed.
b Except as noted, sustained
wind averaging periods for C-MAN and land-based ASOS reports are 2
min; buoy averaging periods are 8 min.
cStorm surge is water height
above normal astronomical tide level.
d Storm tide is water height
above National Geodetic Vertical Datum (1929 mean sea level).
*Last of several occurrences
#Instrument failed after report |
Table 5: Unofficial observations for
Hurricane Ivan, 2-24 September 2004.
| | Minimum
Sea-level
Pressure | Maximum Surface Wind Speed
(kt) | |
| Location | Date/
Time
(UTC) | Press.
(mb) | Date/
Timea
(UTC) | Sust.
Windb
(kts) | Peak
Gust (kts) | Storm
Surgec
(ft) | Storm
Tided
(ft) | Rain
(storm total)
(in) |
| Windward Islands |
| Grenada |
| Calivigny Island | 07/1955 | 969.0 | 07/1955 | 80 | 100 | | | |
| 4 SE Princkly
Bay | | | 07/2230 | 70 | | | | |
| St. Georges
Harbour | 07/1950 | 978.0 | 07/2230 | 60 | | | | |
| Tobago |
| HAM Radio
9Y4PDE | | | | | | | | 16.20 |
| Trinidad |
| HAM radio
VE7KSN | 07/2159 | 980.0 | | | | | | |
| Jamaica |
| 2W Kingston (HAM
rpt) | | | 10/2300 | 39 | 59 | | | |
| Kingston (HAM rpt) | | | 11/0055 | | 57 | | | |
| Kingston Downtown (HAM
rpt) | | | 10/2350 | est. 74 | est. 109 | | | |
| 3W Montego Bay (HAM
rpt) | | | 11/0139 | est. 87 | | | | |
| Cuba |
| Cabo de San
Antonio | | | 14/???? | est. 116 | est. 146 | | | |
| Punta del
Holandes | | | 14/???? | est. 100 | est. 116 | | | |
| Mexico |
| Cancun (HAM rpt) | | | 13/0225 | 44 | | | | |
| Isla Mujeres (HAM
rpt) | | | 13/2200 | 38 | | | | |
| Alabama |
| Fairhope (storm
chaser) | 16/???? | 943.1 | | | | | | |
| Fairhope - WEMITE
2(30.5N
87.89W) | | | 16/0342 | 42 | 62 | | | |
| Fairhope - Florida
Coastal Monitoring Program (FCMP) - Tower 2 (30.48N
87.87W) | | | 16/0644 | 59 | 77 | | | |
| FCMP Tower2 -
Fairhope (30.48°N
87.88°W) | | | 16/0644 | 59 | 77 | | | |
| Gulf Shores Arpt
- DOW3 (30.29°N
87.67°W) | | | 16/???? | 73 | 95 | | | |
| Gulf Shores Arpt - WEMITE
1 (30.3°N
87.66°W) | | | 16/0615 | 70 | 89 | | | |
| Gulf Shores - Mark
Sudduth / HIRT (30.25°N
87.75°W) | 15/2017 | 1003.9 | 15/2017 | 32 | 57 | | | |
| 16/0647 | 947.2 | 16/0602* | 77 | 99 | | | |
| Mobile (Wallace Tunnel) | | | 16/0940 | | 51 | | | |
| Mobile (WKRG-TV) | | | 16/0604 | | 64 | | | |
| Mobile Bay (USNS Fisher - ship
in dry dock) | 16/0830 | 957.0 | | | | | | |
| USS Alabama
(battleship) | | | 16/0635* | | 91 | | | |
| Sailboat Odalisque anchored in Wolf
Bay / Orange Beach, AL (72 ft) | | | 16/0600# | | 126 | | | |
| Wolf Field Airport -
MIPS (30.35°N
87.54°W) | | | 16/0515 | 66 | 87 | | | |
| Florida |
| Carabelle Beach (HAM
rpt) | 15/2216 | 999.0 | 15/2216 | 28 | 37 | | | |
| Cudjoe Key -
SKYWARN | | | 13/1348 | | 36 | | | |
| Destin Arpt -
SBCCOM / CR5000 (30.4°N
86.48°W) | | | 16/0652 | 60 | 77 | | | |
| Eglin AFB
Sensors | | | | | | | | |
| 5 S Harold | 16/0850 | 981.4 | | | | | | |
| 10 S Harold | 16/0740 | 982.1 | 16/0710 | | 78 | | | 5.72 |
| 10 N Mary
Esther | 16/0820 | 986.8 | 16/0730 | | 75 | | | |
| 5 NE
Seminole | 16/0920 | 992.1 | 16/0940 | | 75 | | | 8.10 |
| 5 SW Mossy
Head | 16/0900 | 991.0 | | | | | | |
| 8 SW Mossy
Head | | | 16/0710 | | 60 | | | |
| 10 S Mossy
Head | 16/0900 | 994.2 | | | | | | 8.92 |
| 2 SW Mary Esther (200
ft) | | | 16/0850 | | 103 | | | |
| Molino Volunteer Fire
Dept. | | | 16/0855 | | 70 | | | |
| Pensacola - Florida Coastal Monitoring Program (FCMP) Tower
1 (30.48°N 87.19°W) | | | 16/0649 | 69 | 92 | | | |
| Pensacola P.D. (70 ft) | | | 16/0644 | | 108 | | | 13.50 |
| | | 16/0312 | | 97 | | | |
| | | 16/0700 | | 92 | | | |
| St. George Island (HAM rpt) | 16/0150 | 1005 | 16/0150 | 39 | | | | |
| West
Pensacola | | | 16/???? | | 84 | | | |
| Georgia |
| Greenville (HAM rpt) | | | 16/1730 | | 48 | | | |
| Newnan | 16/2215 | 963.1 | 17/0011 | | 45 | | | |
| Mississippi |
| Gulfport Arpt - SBCCOM / CR23X (30.4°N
80.1°W) | | | 16/0415 | 44 | 62 | | | |
| Pascagoula EOC (on
2-story bldg) | | | 16/0600 | | 76 | | | |
aDate/time is for sustained
wind when both sustained and gust are listed.
bExcept as noted, sustained
wind averaging periods for C-MAN and land-based ASOS reports are 2
min; buoy averaging periods are 8 min.
cStorm surge is water height
above normal astronomical tide level.
dStorm tide is water height
above National Geodetic Vertical Datum (1929 mean sea level).
*Instrument failed afterwards.
#Approximate time. |
Table 6: Preliminary forecast evaluation
(heterogeneous sample) for Hurricane Ivan, 9-14 August 2004.
Forecast errors (n mi) are followed by the number of forecasts in
parentheses. Errors smaller than the NHC official forecasts are
shown in bold-face type. Verification includes the depression
stage.
| Forecast Technique | Period (hours) |
| 12 | 24 | 36 | 48 | 72 | 96 | 120 |
| CLP5 | 25 (62) | 51 (60) | 86 (58) | 121 (55) | 175 (51) | 229 (47) | 296 (44) |
| GFNI | 27 (57) | 57 (55) | 95 (55) | 134 (53) | 219 (49) | 325 (45) | 443 (41) |
| GFDI | 28 (60) | 52 (58) | 77 (57) | 94 (55) | 147 (51) | 204 (47) | 261 (43) |
| GFDL | 29 (61) | 52 (59) | 76 (57) | 92 (56) | 136 (52) | 195 (48) | 252 (44) |
| GFDN | 29 (56) | 51 (54) | 79 (53) | 118 (53) | 198 (49) | 298 (45) | 412 (41) |
| GFSI | 29 (60) | 55 (58) | 79 (57) | 100 (55) | 154 (51) | 212 (47) | 285 (43) |
| GFSO | 32 (63) | 56 (61) | 80 (58) | 99 (56) | 147 (52) | 198 (48) | 268 (43) |
| AEMI | 27 (60) | 49 (58) | 73 (57) | 95 (55) | 151 (51) | 203 (47) | 252 (43) |
| NGPI | 26 (59) | 54 (57) | 86 (56) | 119 (54) | 200 (50) | 304 (46) | 449 (42) |
| NGPS | 29 (61) | 52 (59) | 82 (56) | 109 (54) | 186 (50) | 278 (46) | 413 (42) |
| UKMI | 24 (58) | 47 (56) | 72 (55) | 92 (53) | 147 (49) | 214 (45) | 286 (41) |
| UKM | 26 (30) | 44 (29) | 66 (28) | 87 (28) | 133 (26) | 189 (24) | 279 (22) |
| A98E | 27 (61) | 43 (59) | 72 (57) | 103 (55) | 179 (51) | 248 (47) | 349 (44) |
| A9UK | 27 (28) | 43 (27) | 71 (26) | 95 (25) | 149 (23) | | |
| BAMD | 31 (61) | 54 (59) | 78 (57) | 96 (55) | 147 (51) | 219 (47) | 300 (44) |
| BAMM | 32 (61) | 53 (59) | 86 (57) | 116 (55) | 172 (51) | 214 (47) | 283 (44) |
| BAMS | 48 (61) | 93 (59) | 142 (57) | 179 (55) | 236 (51) | 251 (47) | 286 (44) |
| CONU | 22 (60) | 47 (58) | 74 (57) | 97 (55) | 154 (51) | 224 (47) | 307 (43) |
| GUNA | 22 (58) | 45 (56) | 71 (55) | 92 (53) | 147 (49) | 213 (45) | 289 (41) |
| FSSE | 21 (53) | 38 (51) | 58 (51) | 81 (51) | 126 (47) | 171 (43) | 199 (38) |
| OFCL | 24 (63) | 47 (61) | 79 (59) | 108 (56) | 161 (52) | 222 (48) | 289 (44) |
| NHC Official, 1994 - 2003 mean (number of cases) | 44 (3172) | 78 (2894) | 112 (2636) | 146 (2368) | 217 (1929) | 248 (421) | 319 (341) |
|
Table 7: Watch and warning summary for
Hurricane Ivan. 2-24 September 2004.
| Date/Time | Action | Location |
| 5/2100 | Hurricane Watch Issued | Barbados |
| 6/0000 | Tropical Storm Watch Issued | Grenada and Dependencies |
| 6/0300 | Hurricane Watch Issued | St. Lucia |
| 6/1200 | Tropical Storm Warning Issued | St. Vincent and Grenadines |
| 6/1200 | Hurricane Watch Issued | Martinique |
| 6/1200 | Tropical Storm Warning Issued | Tobago, Grenada and Dependencies |
| 6/1500 | Hurricane Warning Issued | Barbados, St. Vincent, Grenadines, St. Lucia, Tobago, Grenada and Dependencies |
| 6/1500 | Tropical Storm Warning Issued | Trinidad |
| 7/0300 | Tropical Storm Warning Issued | Martinique |
| 7/0600 | Tropical Storm Warning Issued | St. Lucia, St. Vincent, Grenadines, Grenada and Dependencies |
| 7/0900 | Tropical Storm Warning Issued | Barbados |
| 7/1500 | Hurricane Watch Issued | Bonaire, Curacao, Aruba |
| 7/2100 | Tropical Storm Warning Issued | Tobago, Bonaire, Curacao, Aruba |
| 7/2100 | Hurricane Watch and Tropical Storm Warning Issued | Guajira Peninsula Northern Coast of Venezuela |
| 7/2245 | Tropical Storm Warning Discontinued | Martinique |
| 8/0000 | Tropical Storm Warning Discontinued | Trinidad, Tobago |
| 8/0300 | Hurricane Warning Issued | Bonaire, Curacao, Aruba |
| 8/0300 | Tropical Storm Warning Discontinued | St. Lucia |
| 8/0900 | Tropical Storm Warning Discontinued | Barbados, St. Vincent, Grenadines, Grenada and Dependencies |
| 8/0900 | Tropical Storm Watch Issued | Santo Domingo to D.R. / Haiti Border |
| 8/1500 | Hurricane Watch Issued | D.R. / Haiti Border to Port-Au-Prince |
| 8/2100 | Hurricane Watch Issued | Jamaica |
| 9/0300 | Hurricane Watch Issued | Cayman Islands |
| 9/0300 | Tropical Storm Warning Issued | D.R. / Haiti Border to Port-Au-Prince |
| 9/1500 | Hurricane Warning Issued | Jamaica |
| 9/1500 | Hurricane Watch Issued | Barahona to D.R. / Haiti Border |
| 9/1500 | Hurricane Warning Discontinued | Bonaire, Curacao, Aruba |
| 9/1500 | Hurricane Watch and Tropical Storm Warning Discontinued | Guajira Peninsula Northern Coast of Venezuela |
| 9/1500 | Hurricane Watch Issued | Matanzas eastward |
| 9/2100 | Hurricane Warning Issued | Cayman Islands |
| 10/1500 | Hurricane Watch | All Cuba and Isle of Youth |
| 10/1500 | Tropical Storm Warning Issued | Cabo
Cruz to Santiago De Cuba |
| 10/1500 | All Watches/Warnings Discontinued | Dominican Republic |
| 11/0900 | Tropical Storm Warning Extended West | Cabo Cruz to Cienfuegos |
| 11/0900 | Tropical Storm Warning Discontinued | Haiti |
| 11/1500 | Hurricane Warning Issued | Ciago
De Avila to Pinar Del Rioand Isle of Youth |
| 12/0300 | Tropical Storm Warning Issued | Jamaica |
| 12/1500 | Tropical Storm Warning Discontinued | Jamaica |
| 12/1500 | Tropical Storm Watch Issued | 7 Mile Bridge to Dry Tortugas |
| 12/2100 | Hurricane Watch and Tropical Storm Warning Issued | Tulum to Progreso (Yucatan) |
| 13/0900 | Hurricane Warning Issued | Tulum to Progreso |
| 13/1500 | Hurricane Warning Discontinued | Cayman Islands |
| 14/0000 | Hurricane Warning Adjusted | Havana east to Pinar Del Rio and Isle of Youth |
| 14/0300 | Hurricane Watch Issued | Morgan City, LA to St. Marks, FL |
| 14/1500 | Tropical Storm Warning Issued | Tulum to Progreso (Yucatan) |
| 14/1800 | Tropical Storm Warning Issued | Havana east to Pinar Del Rio and Isle of Youth |
| 14/2100 | Hurricane Warning Issued | Grand Isle, LA to Apalachicola , FL |
| 14/2100 | Hurricane Watch Issued | Morgan City, LA to Grand Isle, LA |
| 14/2100 | Tropical Storm Warning Issued | Intracoastal City, LA to Grand Isle,
LA Apalachicola, FL to Yankeetown, FL |
| 14/2100 | All Watches/Warnings Discontinued | Yucatan, Cuba |
| 15/0300 | Tropical Storm Watch Discontinued | 7 Mile Bridge to Dry Tortugas |
| 15/2100 | Tropical Storm Warning Discontinued | Morgan City, LA to Intracoastal City,
LA |
| 16/0900 | All Watches and Warnings Discontinued | West of Grand Isle, LA |
| 16/0900 | Tropical Storm Warning Issued | Mouth of Pearl River, LA to Grand Isle,
LA |
| 16/1200 | Tropical Storm Warning Discontinued | Apalachicola, FL to Yankeetown, FL |
| 16/1500 | Tropical Storm Warning Issued | Mouth of Pearl River, LA to Apalachicola,
FL |
| 16/1500 | Tropical Storm Warning Discontinued | Grand Isle, LA to Mouth of Pearl River,
LA |
| 16/1800 | Tropical Storm Warning Discontinued | West of MS/LA Border |
| 16/2100 | Tropical Storm Warning Discontinued | MS/LA Border to Apalachicola , FL |
| 22/2300 | Tropical Storm Warning Issued | Mouth of MS River to Sargent, TX |
| 23/1500 | Tropical Storm Warning Discontinued | Mouth of MS River to Morgan City, LA |
| 23/2100 | Tropical Storm Warning Discontinued | San Luis Pass, TX to Sargent, TX |
| 24/0300 | All Warnings Discontinued | Remaining Coastal (San Luis Pass, TX to
Morgan City, LA) |

Figure 1:
Best track positions for Hurricane Ivan, 2-24 September
2004.
Figure 2a:
Selected wind observations and best track maximum sustained
surface wind speed curve for Hurricane Ivan, 2-24 September 2004. Aircraft
observations have been adjusted for elevation using 90%, 80%, and 80%
reduction factors for observations from 700 mb, 850 mb, and 1500 ft,
respectively.
Figure 2b:
Selected wind observations and best track maximum sustained
surface wind speed curve for Hurricane Ivan during the peak intensity period
of 9-16 September 2004.
Figure 2c:
Selected wind observations and best track maximum sustained
surface wind speed curve for Hurricane Ivan approximately 24h prior to and
18 h after landfall (15-17 September 2004) along the Alabama coast. The
highest surface winds occurred along the extreme western Florida panhandle
coastal areas, well east of where the center actually made landfall along
the Alabama coast.
Figure 3a:
Pressure observations and minimum central pressure curve
for Hurricane Ivan, 2-24 September 2004.
Figure 3b:
Pressure observations and minimum central pressure curve
for Hurricane Ivan during its period of greatest intensity (9-16 September
2004).
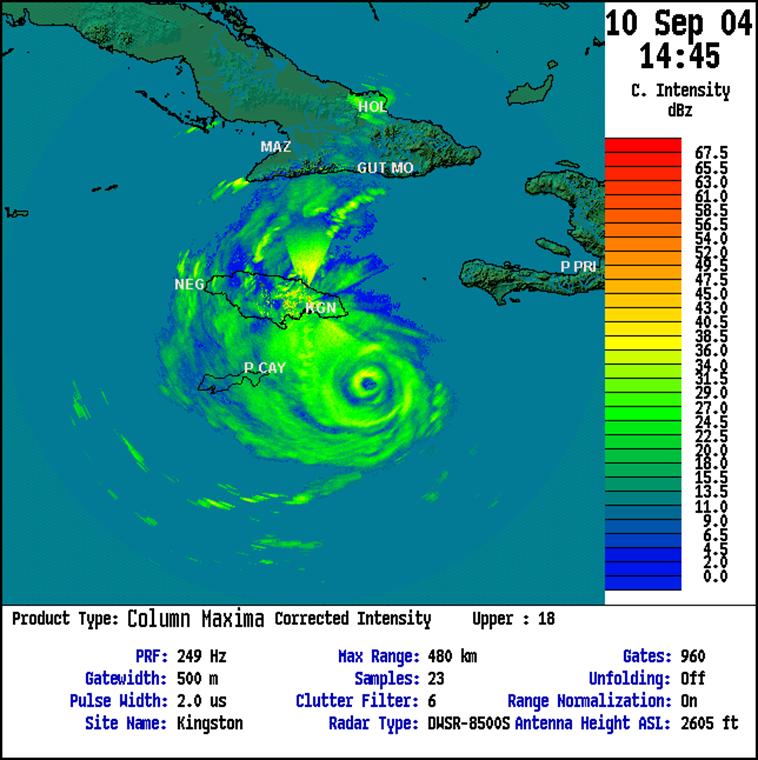
Figure 4a:
Radar reflectivity image from Kingston, Jamaica at 1444 UTC
10 September 2004 as Ivan was approaching the island from the southeast.
Ivan had weakened from a category 5 hurricane down to category 4 hurricane
with sustained winds of 125 kt at this time. Note the two concentric
eyewalls that likely were the cause of the short term weakening (image
courtesy of the Jamaica Meteorological Service).
Figure 4b:
Radar reflectivity image from Cancun, Mexico at 2342 UTC 13
September 2004. Ivan was a category 5 hurricane with sustained winds of 140
kt and a pressure of 914 mb at this time (image courtesy of the National
Meteorological Service of Mexico).
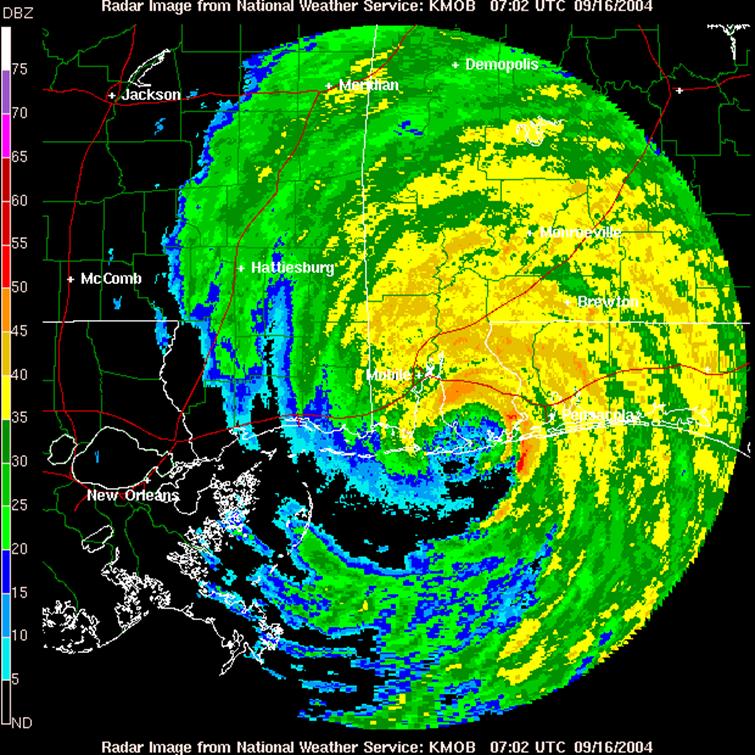
Figure 4c:
Reflectivity image of Hurricane Ivan from the Mobile, AL
National Weather Service Forecast Office WSR-88D Doppler radar at 0702 UTC
16 September 2004 -- less than 15 min after the time of landfall along the
Alabama coast. The center of the broad eye of the hurricane was inland over
extreme southern Alabama at this time. An Air Force Reserve reconnaissance
aircraft reported flight-level winds of 120 just offshore in the strong
convective band (red 50 dBZ areas) southwest of Pensacola, Florida at about 20
min after the time of this image. Peak Doppler radar velocities ranged from
120-123 kt at 6,000 ft ASL as Ivan moved onshore.
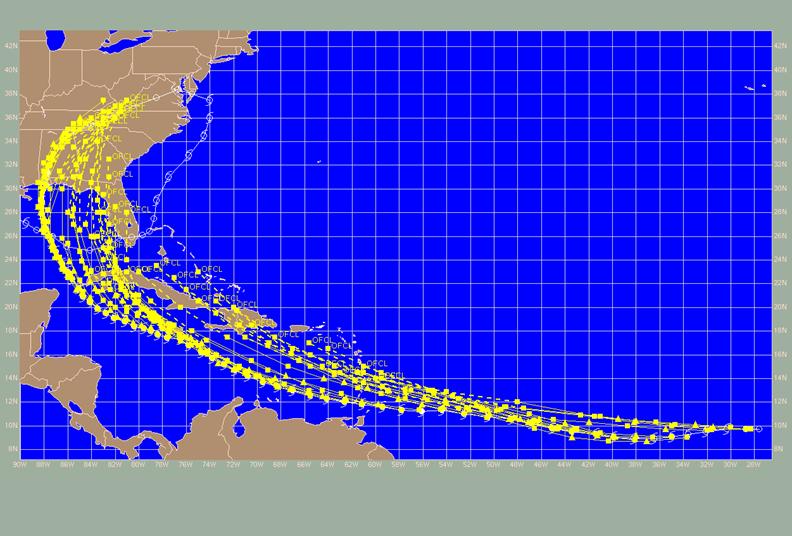
Figure 5a:
NHC Official forecast tracks (OFCL) for Hurricane Ivan
during the period 1800 UTC 02 through 0600 UTC16 September 2004
(1stU.S.landfall). Note the persistent right-of-track bias from
the outset as a result of most of the global models prematurely eroding the
subtropical ridge to the north of the hurricane.

Figure 5b:
NHC Official forecast tracks (OFCL) for Hurricane Ivan
during the period 0600 UTC 13 September to 0000 UTC 16 September 2004. Note
the small spread in the forecast tracks (from 72 h through 6 h prior to
landfall), which targeted the Alabama and extreme western Florida panhandle
coastal areas as the most likely region where landfall would occur.
Figure 6:
United States rainfall totals for Hurricane Ivan (image
courtesy of NOAA Hydrometeorological Prediction Center).
|