Tropical Cyclone Report
Tropical Storm Earl
13 - 15 August 2004
Miles B. Lawrence
National Hurricane Center
25 November 2004
Earl was a short-lived tropical storm that
moved quickly across the Windward Islands of the Caribbean with
brief but heavy rains and winds up to 45 kt.
a. Synoptic History
Earl formed from a tropical wave that moved
from Africa to the eastern tropical Atlantic Ocean on 10 August.
The wave developed into a tropical depression on 13 August while
centered about 1000 n mi east of the Lesser Antilles. The tropical
cyclone was embedded in deep easterly flow to the south of a strong
subtropical ridge and moved westward at 18 to 25 kt during its 48
hours of existence. Based on banding features observed on satellite
imagery and the associated Dvorak intensity estimates, the
depression is estimated to have strengthened to Tropical Storm Earl
on 14 August while centered about 325 n mi east of Barbados. Earl
moved quickly across the southern Windward Islands on 15 August
with maximum one-minute surface wind speeds estimated at 45 kt and
briefly brought tropical storm conditions or near-tropical storm
conditions to Barbados, Grenada, St. Vincent and the Grenadines.
Shortly thereafter, even though the system appeared to be
well-organized on satellite imagery, a hurricane hunter aircraft
reported that the low level circulation was not well-defined,
probably due to the fast forward speed of motion. Earl degenerated
to an open tropical wave later on 15 August. The remnant wave was
eventually tracked to the eastern Pacific Ocean where it developed
into Hurricane Frank on 23 August.
The "best track" chart of the tropical
cyclone's path is given in Figure 1, with the wind and pressure
histories shown in Figure 2 and Figure 3,
respectively. The best track
positions and intensities are listed in Table 1.
b. Meteorological Statistics
Observations in Earl (Figure 2 and Figure 3)
include satellite-based Dvorak technique intensity estimates from
the Tropical Analysis and Forecast Branch (TAFB), the Satellite
Analysis Branch (SAB) and the U. S. Air Force Weather Agency
(AFWA), and flight-level observations from one mission of the
53rd Weather Reconnaissance Squadron of the U. S. Air
Force Reserve Command on 15 August. Earl's maximum one-minute
surface winds are estimated to be 45 kt on 15 August, based on NASA
QuikSCAT microwave satellite data, as well as from the sources
mentioned above. The highest surface wind reports received were 30
knots at Barbados and St. Lucia, as Earl passed over the Windward
Islands on the morning of 15 August.
There were no ship reports of winds of
tropical storm force associated with Earl while it was a tropical
cyclone. After Earl degenerated to an open wave, two ships reported
tropical storm force winds associated with the fast-moving wave
over the central Caribbean Sea. The Buffalo Soldier
reported 35-knot east winds on 17 August while located just north
of Colombia and the ship with call sign A8CF2
reported 37-knot east winds on 16 and 17 August while located just
south of Haiti.
c. Casualty and Damage Statistics
There were no reports of casualties
associated with Earl. Fox News reported that Tropical Storm Earl's
winds tore off about a dozen roofs throughout Grenada and that
there was flooding in western Grenada. Also, at least two roofs
were destroyed in nearby St. Vincent and the Grenadines and banana
crops were damaged there.
d. Forecast and Warning Critique
Earl was a tropical cyclone for only 48
hours, precluding the verification of forecasts at longer time
periods. The official track errors that were verified ranged up to
217 n mi at 48 hours and these errors were above long-term average
errors. These large errors were primarily the result of a slow bias
to the forecasts of the storm's fast forward speed of motion. The
watches and warnings issued for the Windward Islands are listed in
Table 2.
Table 1: Best track for Tropical Storm
Earl, 13-15 August 2004.
Date/Time
(UTC) | Position | Pressure
(mb) | Wind Speed
(kt) | Stage |
Lat.
(°N) | Lon.
(°W) |
| 13/1800 | 9.0 | 45.6 | 1011 | 30 | tropical
depression |
| 14/0000 | 9.2 | 47.4 | 1011 | 30 | " |
| 14/0600 | 9.6 | 49.2 | 1011 | 30 | " |
| 14/1200 | 10.1 | 51.4 | 1011 | 30 | " |
| 14/1800 | 10.5 | 53.5 | 1010 | 35 | tropical storm |
| 15/0000 | 11.0 | 55.9 | 1010 | 35 | " |
| 15/0600 | 11.5 | 58.3 | 1009 | 45 | " |
| 15/1200 | 11.8 | 60.8 | 1009 | 45 | " |
| 15/1800 | 12.1 | 62.8 | 1010 | 35 | " |
| 16/0000 | | | | | dissipated to open
tropical wave |
| 15/0600 | 11.5 | 58.3 | 1009 | 45 | minimum pressure |
Table 2: Watch and warning summary for
Tropical Storm Earl, 13-15 August 2004.
| Date/Time | Action | Location |
| 14/1500 | tropical storm watch | Barbados, St. Vincent, and St. Lucia |
| 14/2100 | tropical storm warning | Barbados, St. Vincent, the Grenadines,
Trinidad, Tobago, Grenada and its dependencies, and St. Lucia |
| 15/1200 | change tropical storm warning to watch | Barbados |
| 15/1230 | tropical storm warning discontinued | Trinidad and Tobago |
| 15/1500 | tropical storm watch discontinued | Barbados |
| 15/1800 | tropical storm warning discontinued | For the remainder of the Windward Islands |
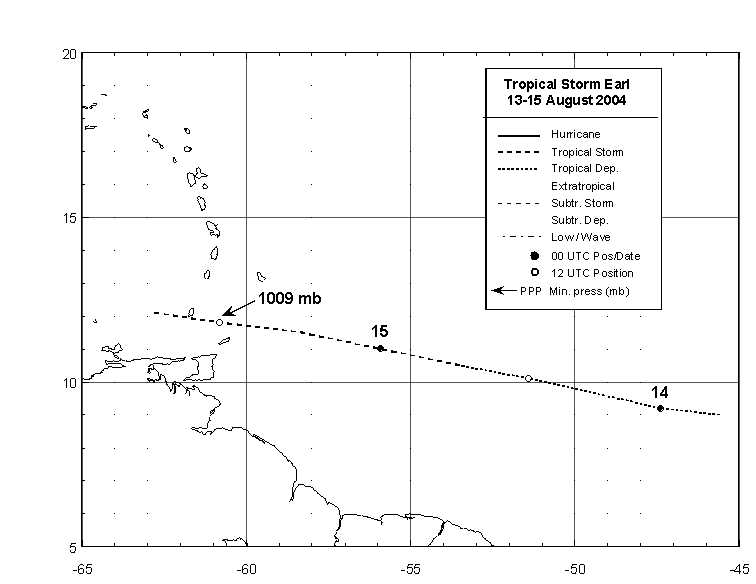
Figure 1:
Best track positions for
Tropical Storm Earl, 13-15 August 2004.
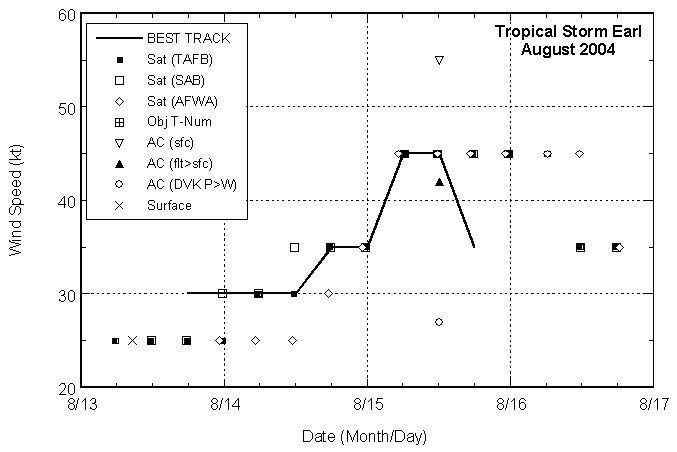
Figure 2:
Selected wind observations and
best track maximum sustained surface wind speed curve for Tropical
Storm Earl, 13-15 August 2004. Aircraft observations at the 850-mb
flight level have been adjusted to the surface using an 80%
adjustment factor.

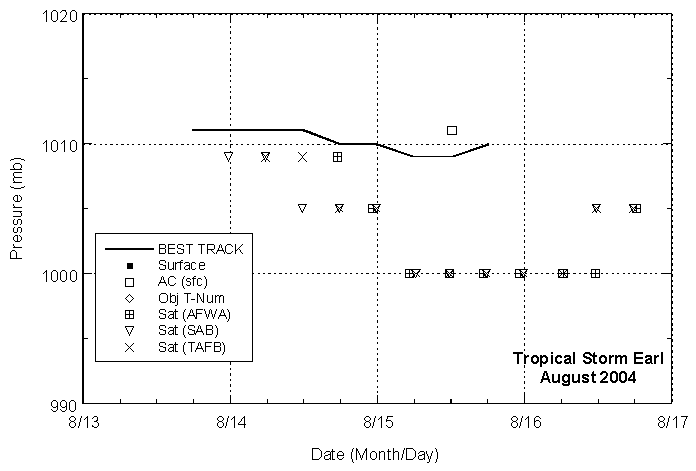
Figure 3:
Selected pressure observations
and best track minimum central pressure curve for Tropical Storm
Earl, 13-15 August 2004.
|