Tropical Cyclone Report
Tropical Storm Bonnie
3 - 13 August 2004
Lixion A. Avila
National Hurricane Center
5 October 2004
Tropical Storm Bonnie made landfall in the
vicinity of St. Vincent Island, Florida as a weak tropical
storm.
a. Synoptic History
Bonnie developed from a tropical wave that
crossed Dakar, Senegal on 29 July, and moved westward for several
days accompanied by cloudiness, thunderstorms and a well-defined
cyclonic rotation at the mid-levels. The shower activity became
concentrated and the system developed a few convective bands as it
moved westward. Data from QuikSCAT suggested that a small surface
circulation had developed, and it is estimated that a tropical
depression formed at 1200 UTC 3 August when the system was located
about 360 n mi east of Barbados in the Lesser Antilles. The
depression moved westward about 20 knots and lost its surface
circulation when it entered the eastern Caribbean Sea. As a
tropical wave, it continued moving rapidly to the west and the
west-northwest producing intermittent convection. Once the system
reached the western Caribbean Sea, it developed significant
convection and regenerated a surface circulation. It is estimated
that the tropical depression re-developed about 100 n mi southeast
of the western tip of Cuba at 1200 UTC 8 August. The depression
move toward the west-northwest across the Yucatan Channel and
became Tropical Storm Bonnie near the northeastern tip of the
Yucatan Peninsula. Bonnie moved north and northeast, reaching its
maximum intensity of 55 knots and a minimum pressure of 1001 mb at
1800 UTC 11 August. Strong southwesterly wind shear became
established over Bonnie and the cyclone began to weaken. It made
landfall near Saint Vincent and Saint George Islands just south of
Apalachicola, Florida as a tropical storm. These winds were
confined to coastal sections to the east of the center. As a
depression, Bonnie continued to move northeastward, across the
eastern United States. It finally became a weak remnant low just
south of Cape Cod at 0000 UTC 14 August.
The "best track" chart of the tropical
cyclone's path is given in Figure 1, with the wind and pressure
histories shown in Figure 2 and Figure 3,
respectively. The best track
positions and intensities are listed in Table 1.
b. Meteorological Statistics
Observations in Bonnie (Figure 2 and Figure 3)
include satellite-based Dvorak technique intensity estimates from
the Tropical Analysis and Forecast Branch (TAFB), the Satellite
Analysis Branch (SAB) and the U. S. Air Force Weather Agency
(AFWA), as well as flight-level and dropwindsonde observations from
flights of the 53rd Weather Reconnaissance Squadron of
the U. S. Air Force Reserve Command. Microwave satellite imagery
from NOAA polar-orbiting satellites, the NASA Tropical Rainfall
Measuring Mission (TRMM), the NASA QuikSCAT, and Defense
Meteorological Satellite Program (DMSP) satellites were also useful
in tracking Bonnie. In addition, radar from Cancun, Mexico, and
from the U.S. NWS network near the Gulf coast were used to analyze
the cyclone when it was located near these sites. Selected ship and
surface observations from land stations and data buoys are given in
Table 2 and Table 3.
Bonnie had a very small circulation when it
regenerated near the Yucatan Peninsula, and initial data from a
reconnaissance plane indicate that it had a closed eyewall of 8 n
mi in diameter. The small center was also observed from the Cancun
radar shown in Figure 4. A reconnaissance plane reported a minimum
pressure of 995 mb at 0941 UTC 12 August when the cyclone was on a
steady weakening trend. This minimum pressure was assumed to be
associated with a meso-cyclone and this value is not representative
of Bonnie's central pressure. A tornado outbreak over the
southeastern United States was associated with Bonnie.
c. Casualty and Damage Statistics
There were three deaths in Pender County,
NC, from a tornado spawned by Bonnie.
d. Forecast and Warning Critique
Average official track errors (with the
number of cases in parentheses) for Bonnie were 43 (16), 75 (14),
87 (11), 78(9), 106(5), 595 (2), and 1038 (5) n mi for the 12, 24,
36, 48, 72, 96, and 120 h forecasts, respectively. For the short
range, these errors are lower than average official track errors
for the 10-yr period 1994-2003[1] (44, 78, 112, 146, 217, 248, and
319 n mi, respectively). However, the 4 and 5 day errors are much
large than the average. The model errors are displayed in Table 4.
Note that dynamical models also had very large errors at the 120-h
period. Models related to climatology produced the smallest
errors.
Average official intensity errors were 8,
10, 12, 11, 8, 8, and 36 kt for the 12, 24, 36, 48, 72, 96, and 120
h forecasts, respectively. For comparison, the average official
intensity errors over the 10-yr period 1994-2003 are 6, 10, 12, 15,
19, 20, and 21 kt, respectively. Note that in general the intensity
errors were similar to the average with the exception of the large
error at 120 hours.
[1]Errors given
for the 96 and 120 h periods are averages over the three-year
period 2001-3.
Table 1: Best track for Tropical Storm
Bonnie, 3-13 August 2004. Positions given during the tropical wave
stage represent the location of the mid-level circulation center
observed on satellite.
Date/Time
(UTC) | Position | Pressure
(mb) | Wind Speed
(kt) | Stage |
Lat.
(°N) | Lon.
(°W) |
| 03 / 1200 | 12.9 | 53.6 | 1010 | 25 | tropical depression |
| 03 / 1800 | 13.2 | 55.4 | 1010 | 25 | " |
| 04 / 0000 | 13.5 | 57.4 | 1010 | 30 | " |
| 04 / 0600 | 13.6 | 59.5 | 1010 | 30 | " |
| 04 / 1200 | 13.6 | 61.6 | 1010 | 30 | " |
| 04 / 1800 | 13.7 | 63.7 | 1010 | 30 | tropical wave |
| 05 / 0000 | 14.0 | 65.7 | 1010 | 25 | " |
| 05 / 0600 | 14.9 | 67.7 | 1010 | 25 | " |
| 05 / 1200 | 16.0 | 69.7 | 1011 | 25 | " |
| 05 / 1800 | 16.5 | 71.5 | 1011 | 25 | " |
| 06 / 0000 | 17.0 | 73.0 | 1011 | 25 | " |
| 06 / 0600 | 17.1 | 74.6 | 1011 | 25 | " |
| 06 / 1200 | 17.2 | 76.2 | 1011 | 25 | " |
| 06 / 1800 | 17.0 | 77.2 | 1011 | 25 | " |
| 07 / 0000 | 17.1 | 78.2 | 1011 | 25 | " |
| 07 / 0600 | 17.4 | 79.2 | 1013 | 20 | " |
| 07 / 1200 | 17.8 | 80.2 | 1013 | 20 | " |
| 07 / 1800 | 18.4 | 81.1 | 1013 | 20 | " |
| 08 / 0000 | 19.0 | 81.9 | 1012 | 20 | " |
| 08 / 0600 | 19.7 | 82.7 | 1010 | 25 | " |
| 08 / 1200 | 20.3 | 83.5 | 1009 | 25 | tropical depression |
| 08 / 1800 | 20.9 | 84.3 | 1008 | 25 | " |
| 09 / 0000 | 21.5 | 85.5 | 1008 | 25 | " |
| 09 / 0600 | 22.0 | 86.6 | 1008 | 30 | " |
| 09 / 1200 | 22.5 | 87.6 | 1008 | 35 | tropical storm |
| 09 / 1800 | 22.9 | 88.3 | 1007 | 40 | " |
| 10 / 0000 | 23.1 | 89.0 | 1006 | 45 | " |
| 10 / 0600 | 23.4 | 89.8 | 1005 | 45 | " |
| 10 / 1200 | 24.0 | 90.6 | 1002 | 50 | " |
| 10 / 1800 | 24.4 | 90.6 | 1003 | 45 | " |
| 11 / 0000 | 24.7 | 90.6 | 1003 | 40 | " |
| 11 / 0600 | 25.2 | 90.6 | 1003 | 40 | " |
| 11 / 1200 | 25.7 | 90.4 | 1001 | 45 | " |
| 11 / 1800 | 26.4 | 89.6 | 1001 | 55 | " |
| 12 / 0000 | 27.0 | 88.8 | 1007 | 50 | " |
| 12 / 0600 | 27.7 | 88.1 | 1008 | 45 | " |
| 12 / 1200 | 29.0 | 86.1 | 1002 | 45 | " |
| 12 / 1800 | 30.2 | 84.0 | 1006 | 30 | tropical depression |
| 13 / 0000 | 31.9 | 81.3 | 1008 | 25 | " |
| 13 / 0600 | 33.5 | 79.0 | 1008 | 25 | " |
| 13 / 1200 | 35.5 | 76.5 | 1008 | 25 | " |
| 13 / 1800 | 37.1 | 74.9 | 1008 | 25 | " |
| 14 / 0000 | 39.0 | 73.5 | 1012 | 20 | low |
| 12 / 1400 | 29.6 | 85.1 | 1002 | 40 | landfall St. Vincent / St. George Islands, FL. |
| 11 / 1800 | 26.4 | 89.6 | 1001 | 55 | minimum pressure |
Table 2: Selected ship reports with winds
of at least 34 kt for Bonnie, 3 -13 August, 2004.
| Ship Name or Call Sign | Date/Time (UTC) | Lat.
(°N) | Lon.
(°W) | Wind dir/speed (deg/kt) | Pressure (mb) |
| ZCIH7 | 10/0900 | 26.3 | 88.6 | 160 / 37 | 1014.0 |
| H3GQ | 10/1800 | 23.8 | 91.0 | 230 / 40 | 1014.0 |
|
Table 3: Selected surface observations for
Tropical Storm Bonnie 3-13 August 2004.
| | Minimum
Sea-level
Pressure | Maximum Surface Wind Speed
(kt) | |
| Location | Date/
Time
(UTC) | Press.
(mb) | Date/
Timea
(UTC) | Sust.
Windb
(kts) | Peak
Gust (kts) | Storm
Surgec
(ft) | Storm
Tided
(ft) | Rain
(storm total)
(in) |
| Florida |
| Apalachicola (NOS) | | | | | | 0.9 | 2.70 | |
| Cedar Key (NOS) | | | | | | 1.9 | 5.21 | |
| Cross City (KCTY) | | | | | | | | 3.22 |
| Gainesville (KGNV) | 12/1636 | 1010.2 | 12/1752 | 23 | 34 | | | 0.12 |
| Perry (K40J) | | | | | | | | 3.11 |
| Buoy/CMAN |
| NOAA Buoy 42001 | | | 11/1440 | 51 | 66 | | | |
| NOAA Buoy 42036 | 12/1450 | 1009.5 | 12/1520 | 31 | 35 | | | |
| NOAA Buoy 42039 | 12/1250 | 1002.9 | 12/1030 | 37 | 47 | | | |
| Tyndall AFB Tower C (SGOF1) | 12/1600 | 1008.5 | 12/1300 | 32 | 40 | | | |
| Unofficial Observations: Florida |
| Alligator Point (Bald Point) 40 ft Level | 12/1629 | 1005.6 | 12/1140 | 30 | 35 | | | 1.35 |
| Mary Esther (Florosa Elementary School AWS) | 12/1214 | 1010.2 | 12/0627 | | 34 | | | |
aDate/time is for sustained
wind when both sustained and gust are listed.
bExcept as noted, sustained
wind averaging periods for C-MAN and land-based ASOS reports are 2
min; buoy averaging periods are 8 min.
cStorm surge is water height
above normal astronomical tide level.
dStorm tide is water height
above National Geodetic Vertical Datum (1929 mean sea level). |
Table 4: Preliminary forecast evaluation
(heterogeneous sample) for Tropical Storm Bonnie, 3-13 August,
2004. Forecast errors (n mi) are followed by the number of
forecasts in parentheses. Errors smaller than the NHC official
forecast are shown in bold-face type. Verification includes the
depression stage, but does not include the extratropical stage, if
any.
| Forecast Technique | Period (hours) |
| 12 | 24 | 36 | 48 | 72 | 96 | 120 |
| CLP5 | 44 (20) | 115 (18) | 230 (15) | 335 (13) | 544 (9) | 577 (6) | 269 (6) |
| GFNI | 40 (11) | 87 (11) | 133 (9) | 180 (7) | 384 (3) | | |
| GFDI | 38 (18) | 62 (16) | 86 (13) | 91 (11) | 150 (7) | 417 (4) | 1248 (5) |
| GFDL | 30 (18) | 46 (15) | 74 (14) | 90 (12) | 121 (8) | 134 (3) | 1273 (3) |
| GFDN | 42 (10) | 79 (10) | 127 (9) | 143 (7) | 274 (3) | | |
| LBAR | 34 (19) | 73 (17) | 122 (15) | 154 (13) | 172 (9) | 247 (6) | 597 (6) |
| GFSI | 48 (14) | 103 (11) | 134 (9) | 138 (4) | 163 (1) | | 1830 (1) |
| GFSO | 40 (14) | 92 (13) | 139 (9) | 166 (5) | 193 (1) | | 1693 (1) |
| AEMI | 51 (15) | 95 (12) | 138 (9) | 159 (7) | 214 (3) | | 803 (1) |
| BAMD | 40 (20) | 73 (18) | 114 (15) | 167 (13) | 302 (9) | 532 (6) | 767 (6) |
| BAMM | 33 (19) | 52 (17) | 90 (15) | 126 (13) | 277 (9) | 490 (6) | 665 (6) |
| BAMS | 42 (19) | 92 (17) | 161 (15) | 241 (13) | 498 (9) | 760 (6) | 1149 (6) |
| NGPI | 46 (14) | 101 (11) | 134 (9) | 189 (7) | 183 (3) | | |
| NGPS | 54 (12) | 96 (10) | 137 (9) | 163 (7) | 206 (4) | | |
| UKMI | 62 (10) | 151 (10) | 194 (8) | 233 (6) | 189 (3) | 907 (1) | 1134 (2) |
| UKM | 42 (7) | 136 (6) | 172 (5) | 255 (4) | 142 (2) | 1774 (1) | 1094 (1) |
| A98E | 40 (20) | 58 (18) | 105 (15) | 129 (13) | 231 (9) | 230 (6) | 322 (6) |
| A9UK | 39 (10) | 73 (9) | 146 (7) | 175 (6) | 266 (4) | | |
| GUNS | 39 (10) | 98 (10) | 117 (8) | 128 (6) | 147 (3) | | |
| GUNA | 42 (10) | 98 (9) | 115 (7) | 131 (3) | 192 (1) | | |
| OFCL | 43 (16) | 75 (14) | 87 (11) | 78 (9) | 106 (5) | 595 (2) | 1038 (5) |
| NHC Official (1994-2003 mean) | 44 (3172) | 78 (2894) | 112 (2636) | 146 (2368) | 217 (1929) | 248 (421) | 319 (341) |
|
Table 5: Watch and warning summary for
Tropical Storm Bonnie, 3-13 August, 2004.
| Date/Time | Action | Location |
| 3/2100 | Tropical Storm Warning Issued | St Lucia |
| 3/2100 | Tropical Storm Watch Issued | Guadeloupe, Martinique, Dominica, St. Maarten,
Saba and St. Eustatius. Puerto Rico and U.S Virgin Islands. |
| 4/1500 | Tropical Storm Watch and Tropical Storm
Warning Discontinued | All locations |
| 11/0300 | Tropical Storm Watch issued | Alabama/Florida border to mouth of Suwannee
River |
| 11/1500 | Tropical Storm Warning and Hurricane Watch
Issued | Alabama/Florida border to mouth of Suwannee
River |
| 11/2100 | Hurricane Warning Issued | Florida from Destin to the mouth of Suwannee
River |
| 12/0900 | Hurricane Warning and Watch Discontinued | All locations |
| 12/1500 | Tropical Storm Warning Discontinued | West of Destin |
| 12/2100 | Tropical Storm Warning Discontinued | All locations |
Figure 1:
Best track positions for Bonnie,
3-13 August, 2004. Track after landfall stage is based on analyses
from the NOAA Hydrometeorological Prediction Center (HPC).
Figure 2:
Selected wind observations and
best track maximum sustained surface wind speed curve for Tropical
Storm Bonnie, 3-13 August 2004. Aircraft observations have been
adjusted for elevation using 90%, 80%, and 80% reduction factors
for observations from 700 mb, 850 mb, and 1500 ft, respectively.
Dropwindsonde observations include actual 10 m winds (sfc), as well
as surface estimates derived from the mean wind over the lowest 150
m of the wind sounding (LLM), and from the sounding boundary layer
mean (MBL). Objective Dvorak estimates represent linear averages
over a three-hour period centered on the nominal observation time.
Estimates after landfall are based on analyses from the NOAA
Hydrometeorological Prediction Center.

Figure 3:
Selected pressure observations
and best track minimum central pressure curve for Bonnie, 3-13
August, 2004. Estimates after landfall are based on analyses from
the NOAA Hydrometeorological Prediction Center.
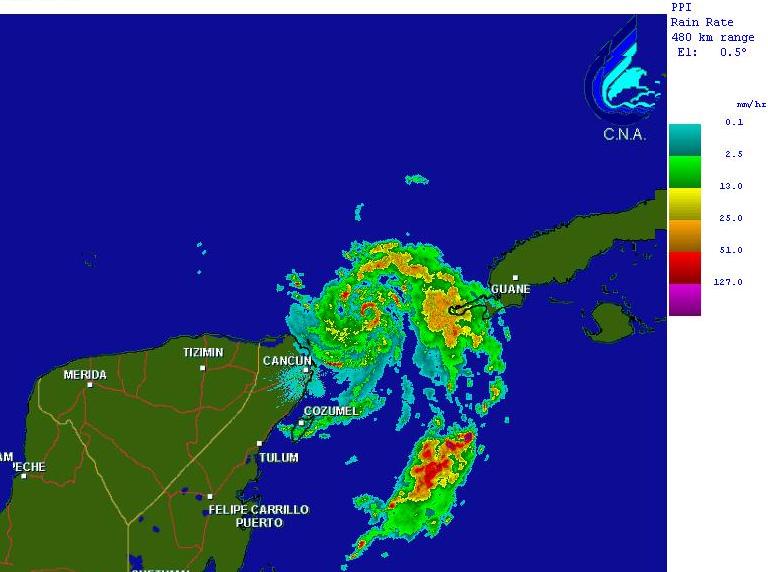
Figure 4:
Radar image from Cancun, Mexico
at 0516 UTC 9 August, showing the small center of the developing
cyclone.
|