Maps and Data
Find maps and charts showing transportation data and trends related to alternative fuels and vehicles.
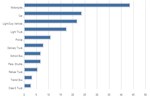
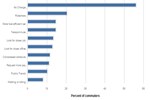
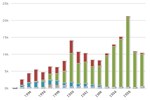
Average Annual Vehicle Miles Traveled of Major Vehicle Categories
| Class 8 Truck | Transit Bus | Refuse Truck | Para. Shuttle | Light Truck | Police | Delivery Truck | School Bus | Light-Duty Vehicle | Car | Motorcycle | |
| VMT | 68907.3577806261 | 35967 | 25000 | 22724 | 15463.156890368515 | 15160 | 13468.5537554749 | 12000 | 11489.359283161726 | 10648.613411352018 | 2248.096677593978 |
Source: Federal Highway Administration Table VM-1 American Public Transit Association's Public Transportation Fact Book Tables 8, 9, 12, and 15.
This chart shows average annual vehicle miles traveled (per vehicle) by major vehicle categories in the United States. Class 8 trucks typically travel longer distances than any other vehicle type. Transit buses, refuse trucks, and paratransit shuttles also log high numbers of miles on average. See also Average Annual Fuel Use of Major Vehicle Categories and Average Fuel Economy of Major Vehicle Categories.