Maps and Data
Find maps and charts showing transportation data and trends related to alternative fuels and vehicles.
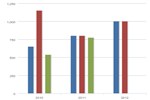
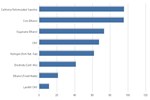
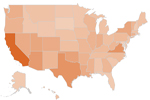
Populations Covered by Clean Cities Coalitions
| >10 | 5-10 | 4-5 | 3-4 | 2-3 | 1-2 | 0.5-1 | 0.2-0.5 | |
| Number of Coalitions | 1 | 11 | 8 | 7 | 15 | 20 | 12 | 11 |
Source: Clean Cities annual metrics reports, 2004-2010.
This chart shows the sizes of populations living inside the boundaries of Clean Cities coalitions. Most coalitions include major metropolitan areas. In total, about three-quarters of the U.S. population lives inside the boundary of a Clean Cities coalition.