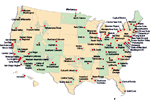
Maps and Data
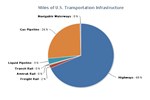
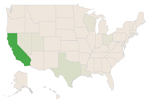
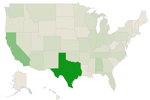
Find maps and charts showing transportation data and trends related to alternative fuels and vehicles.
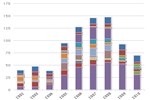
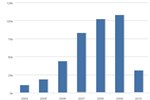
U.S. Consumption of Ethanol and MTBE Oxygenates
| 1992 | 1993 | 1994 | 1995 | 1996 | 1997 | 1998 | 1999 | 2000 | 2001 | 2002 | 2003 | 2004 | 2005 | 2006 | 2007 | 2008 | 2009 | |
| MTBE | 1.175964 | 2.070897 | 2.020455 | 2.693407 | 2.751955 | 3.106745 | 2.905781 | 3.40539 | 3.298803 | 3.354949 | 3.122859 | 2.3684 | 1.8773 | 1.6545 | 0.435 | 0 | 0 | 0 |
| Ethanol | 0.719408 | 0.779958 | 0.868113 | 0.934615 | 0.677537 | 0.852514 | 0.912858 | 0.975255 | 1.114313 | 1.173323 | 1.450721 | 1.919572 | 2.414167 | 2.756663 | 3.729168 | 4.694304 | 6.442781 | 7.343133 |
Source: EIA Annual Energy Review, 2011 Table 10.5 from the U.S. Energy Information Administration
Notes: Fuel volumes are expressed in gasoline gallon-equivalents (GGEs), representing a volume of fuel with the same energy content as a gallon of gasoline.
This chart shows trends in ethanol and methyl tertiary-butyl ether (MTBE) consumption as oxygenates in gasoline from 1992 to 2009. When added to gasoline, both MTBE and ethanol raise the oxygen content of gasoline, increasing its octane rating and lowering tailpipe emissions. The use of both additives was spurred by the Clean Air Act Amendments of 1990 (and subsequent laws). The use of MTBE came under harsh scrutiny in the late 1990s after many instances of groundwater contamination, and many states have banned its use. Today, ethanol is used as a gasoline additive in all 50 states.