Maps and Data
Find maps and charts showing transportation data and trends related to alternative fuels and vehicles.
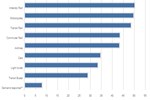
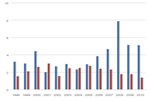
Average Annual Fuel Use of Major Vehicle Categories
| Class 8 Truck | Transit Bus | Refuse Truck | Para. Shuttle | Taxi | Delivery Truck | School Bus | Police | Light Truck | Light-Duty Vehicle | Car | Motorcycle | |
| Annual Fuel Use (GGE) | 12949.557828754969 | 11701.913066111401 | 9876.738305941846 | 3434.03936360559 | 3392 | 2028.9673726189012 | 1896.3337547408344 | 1423.4741784037558 | 897.8988429202213 | 531.0318801499131 | 453.4129586695842 | 33 |
Source: Federal Highway Administration Table VM-1 American Public Transit Association's Public Transportation Fact Book Tables 8, 9, 12, and 15.
Notes: Fuel use is measured in gasoline-gallon equivalents (GGEs), representing a quantity of fuel with the same energy content as a gallon of gasoline.
This chart shows average annual fuel use of major vehicle categories in the United States. The two factors affecting the average annual fuel use of a vehicle are the average miles per year (correlative) and the fuel economy of the vehicle (inversely correlative). Class 8 trucks, which typically travel long distances carrying heavy loads, consume more fuel on average than any other vehicle type. Transit buses and refuse trucks also use large quantities of fuel since they both log high numbers of miles on average and have relatively low fuel economy. The last four vehicle types are owned by individual consumers, and they each use a fraction of the fuel used by fleet-based vehicles, on a per-vehicle basis. See also Average Annual Vehicle Miles Traveled by Major Vehicle Categories and Average Fuel Economy of Major Vehicle Categories.