Maps and Data
Find maps and charts showing transportation data and trends related to alternative fuels and vehicles.
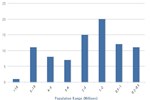
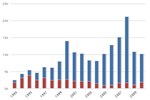
Clean Cities Alternative Fuel Vehicle Inventory
| 2004 | 2005 | 2006 | 2007 | 2008 | 2009 | 2010 | |
| E85 | 47643 | 72899 | 221834 | 385671 | 524169 | 642520 | 403981 |
| Biodiesel* | 31922 | 52275 | 91584 | 98785 | 17222 | 2814 | 88726 |
| CNG | 76257 | 49271 | 57458 | 55021 | 51121 | 44317 | 42911 |
| Propane | 31338 | 21117 | 25543 | 23628 | 22260 | 7937 | 13196 |
| Electric | 9241 | 7350 | 9376 | 4999 | 13761 | 4490 | 8826 |
| LNG | 0 | 1873 | 2271 | 1731 | 2053 | 2038 | 3410 |
| Hydrogen | 23 | 42 | 72 | 86 | 75 | 74 | 62 |
Source: Clean Cities annual coalition reports, 2004-2010.
Notes: *Beginning in 2008, vehicles using B20 only counted as alternative fuel vehicles if they were fleet-based.
This chart shows the number of alternative fuel vehicles on the road in a given year, deployed with help from Clean Cities. The number of E85 vehicles reported in 2010 dropped as efforts were made to ensure that only vehicles that were in Clean Cities fleets or refueling at Clean Cities stations were counted.