Maps and Data
Find maps and charts showing transportation data and trends related to alternative fuels and vehicles.
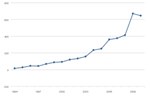
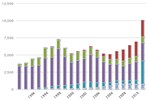
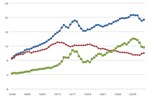
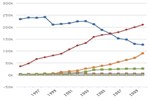
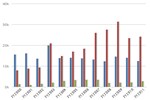
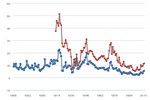
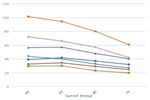
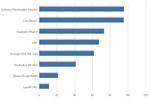
Average Retail Fuel Prices in the U.S.
| Apr-10-2000 | Oct-9-2000 | Jun-4-2001 | Oct-22-2001 | Feb-11-2002 | Apr-15-2002 | Jul-22-2002 | Oct-28-2002 | Feb-10-2003 | Dec-8-2003 | Mar-8-2004 | Jun-14-2004 | Nov-15-2004 | Mar-21-2005 | Sep-1-2005 | Jan-1-2006 | May-24-2006 | Sep-4-2006 | Feb-21-2007 | Jul-3-2007 | Oct-2-2007 | Jan-1-2008 | Apr-1-2008 | Jul-1-2008 | Oct-1-2008 | Jan-30-2009 | Apr-15-2009 | Jul-31-2009 | Oct-26-2009 | Jan-29-2010 | Apr-12-2010 | Jul-23-2010 | Oct-14-2010 | Feb-7-2011 | May-15-2011 | Jul-14-2011 | Oct-14-2011 | Jan-27-2012 | Mar-30-2012 | Jul-13-2012 | Oct-12-2012 | |
| Gasoline | 1.516 | 1.541 | 1.679 | 1.265 | 1.107 | 1.404 | 1.41 | 1.444 | 1.607 | 1.476 | 1.738 | 1.985 | 1.969 | 2.109 | 2.768926660219828 | 2.2260270917356895 | 2.8370477773926477 | 2.2191508880356694 | 2.3029976124968825 | 3.028862969080607 | 2.7644555531607735 | 2.99 | 3.43 | 3.91 | 3.04 | 1.86 | 2.02 | 2.44 | 2.64 | 2.65 | 2.84 | 2.71 | 2.78 | 3.08 | 3.69 | 3.68 | 3.46 | 3.37 | 3.89 | 3.52 | 3.82 |
| E85 | 1.8 | 1.9 | 1.85 | 1.6 | 1.54 | 1.8 | 1.81 | 1.71 | 1.86 | 1.7 | 1.84 | 2.28 | 2.3 | 2.29 | 3.2105947398453307 | 2.645566143056072 | 3.237445754163405 | 2.806566651662191 | 2.7946946934825565 | 3.50492658397064 | 3.2003521058660405 | 3.55 | 4.06 | 4.62 | 3.99 | 2.56 | 2.66 | 3.01 | 3.21 | 3.36 | 3.42 | 3.25 | 3.45 | 3.89 | 4.52 | 4.6 | 4.51 | 4.44 | 4.89 | 4.58 | 4.91 |
| CNG | 0.89 | 1.02 | 1.3 | 1.19 | 1.09 | 1.07 | 1.2 | 1.17 | 1.2 | 1.35 | 1.4 | 1.4 | 1.56 | 1.56 | 2.1238737214695322 | 1.9931037808364291 | 1.9036849002315575 | 1.7677987086308466 | 1.9415697877000018 | 2.097983723229701 | 1.774084671247051 | 1.93 | 2.04 | 2.34 | 2.01 | 1.63 | 1.64 | 1.73 | 1.86 | 1.85 | 1.9 | 1.91 | 1.93 | 1.93 | 2.06 | 2.07 | 2.09 | 2.13 | 2.08 | 2.05 | 2.12 |
| Propane | 1.62 | 1.76 | 1.72 | 1.62 | 1.62 | 1.95 | 1.55 | 1.66 | 2.09 | 2.21 | 2.48 | 2.13 | 2.91 | 2.65 | 3.4978659409179187 | 2.7119553048832405 | 2.846717035920939 | 3.1835922931781964 | 3.5774777418213954 | 3.526512430604909 | 3.754438817543509 | 4.31 | 4.36 | 4.34 | 4.67 | 3.77 | 3.56 | 3.43 | 3.72 | 4.13 | 3.99 | 4.01 | 3.93 | 4.22 | 4.41 | 4.26 | 4.23 | 4.26 | 4.02 | 3.64 | 3.54 |
| Diesel | 1.290591825613079 | 1.4586941222265475 | 1.368316543402102 | 1.1911764889061893 | 1.0420534838458546 | 1.1929840404826781 | 1.184850058388478 | 1.3520485792137018 | 1.5020753600622812 | 1.3384919423900352 | 1.4713469832619697 | 1.5463603736862594 | 1.9268499805371742 | 2.028072868820553 | 2.5365746349543916 | 2.3155838001609435 | 2.6903110710930154 | 2.3676237183873807 | 2.3722072790927142 | 2.6736372747731174 | 2.807348515636177 | 3.05 | 3.71 | 4.22 | 3.27 | 2.19 | 2.04 | 2.27 | 2.5 | 2.57 | 2.71 | 2.65 | 2.75 | 3.09 | 3.62 | 3.54 | 3.42 | 3.46 | 3.71 | 3.36 | 3.7 |
| B20 | 1.3472195468540302 | 1.1822538880555775 | 1.2830662350990762 | 1.3930433409647114 | 1.4663614115418016 | 1.5671737585853003 | 1.6038327938738455 | 1.6129975526959817 | 1.8879403173600695 | 2.0529059761585224 | 2.1078945290913396 | 2.6668073525455687 | 2.4206419187982924 | 2.675129907787363 | 2.433749622732855 | 2.3226631135326374 | 2.713783973576966 | 2.824681540311781 | 3.08 | 3.63 | 4.25 | 3.69 | 2.43 | 2.27 | 2.45 | 2.63 | 2.7 | 2.85 | 2.79 | 2.86 | 3.19 | 3.69 | 3.67 | 3.57 | 3.57 | 3.8 | 3.5 | 3.82 | |||
| B2/B5 | 2.543443216740623 | 2.2283912013447837 | 2.6882479364255913 | 2.492693650163244 | 2.3581825737823903 | 2.571087763380513 | 2.706973576203638 | 2.98 | 3.59 | 4.21 | 3.45 | 2.2 | 2.05 | 2.29 | |||||||||||||||||||||||||||
| B99/B100 | 3.2976289933184724 | 3.135318215482774 | 3.649854481848903 | 3.2122602972112806 | 3.2178785666104903 | 3.170737846763799 | 3.282510311009743 | 3.63 | 4.24 | 4.81 | 4.59 | 3.42 | 3.22 | 3.03 | 3.14 | 3.54 | 3.52 | 3.69 | 3.76 | 3.99 | 4.26 | 4.13 | 4.12 | 4.14 | 4.31 | 4.16 | 4.32 |
Notes: Fuel volumes are measured in gasoline-gallon equivalents (GGEs), representing a quantity of fuel with the same amount of energy contained in a gallon of gasoline.
This chart shows average monthly retail fuel prices in the United States from 2000 to 2012. The price of petroleum fuels (gasoline and diesel fuel) is the primary driver of overall fuel prices. For as petroleum prices rise, so does demand for alternative fuels, thereby pushing their prices upward as well. However, natural gas prices have been buffered from this driver, because its primary market is utilities, and due to recent increases in domestic natural gas production.