Maps and Data
Find maps and charts showing transportation data and trends related to alternative fuels and vehicles.
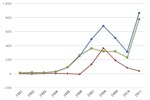
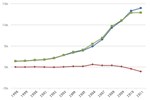
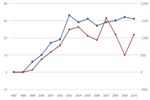
Renewable Fuel Standard Volumes by Year
| 2008 | 2009 | 2010 | 2011 | 2012 | 2013 | 2014 | 2015 | 2016 | 2017 | 2018 | 2019 | 2020 | 2021 | 2022 | |
| Conventional (starch ethanol) | 9 | 10.5 | 12 | 12.6 | 13.2 | 13.8 | 14.4 | 15 | 15 | 15 | 15 | 15 | 15 | 15 | 15 |
| Cellulosic | 0 | 0 | 0.1 | 0.25 | 0.5 | 1 | 1.75 | 3 | 4.25 | 5.5 | 7 | 8.5 | 10.5 | 13.5 | 16 |
| Biomass-based Diesel | 0 | 0.5 | 0.65 | 0.8 | 1 | 1 | 1 | 1 | 1 | 1 | 1 | 1 | 1 | 1 | 1 |
| Other Advanced Fuels | 0 | 0.1 | 0.2 | 0.3 | 0.5 | 1.75 | 2 | 2.5 | 3 | 3.5 | 4 | 4.5 | 4.5 | 4.5 | 5 |
Source: EIA Monthly Energy Review, Table 10.3 and 10.4 and the EPA Renewable Fuels Standard EMTS Informational Data.
The Energy Independence and Security Act of 2007 (EISA) set yearly RFS volume requirements for each renewable fuel category. EPA updates volume requirements each year based on fuel availability.