State Personal Income: Third Quarter 2016
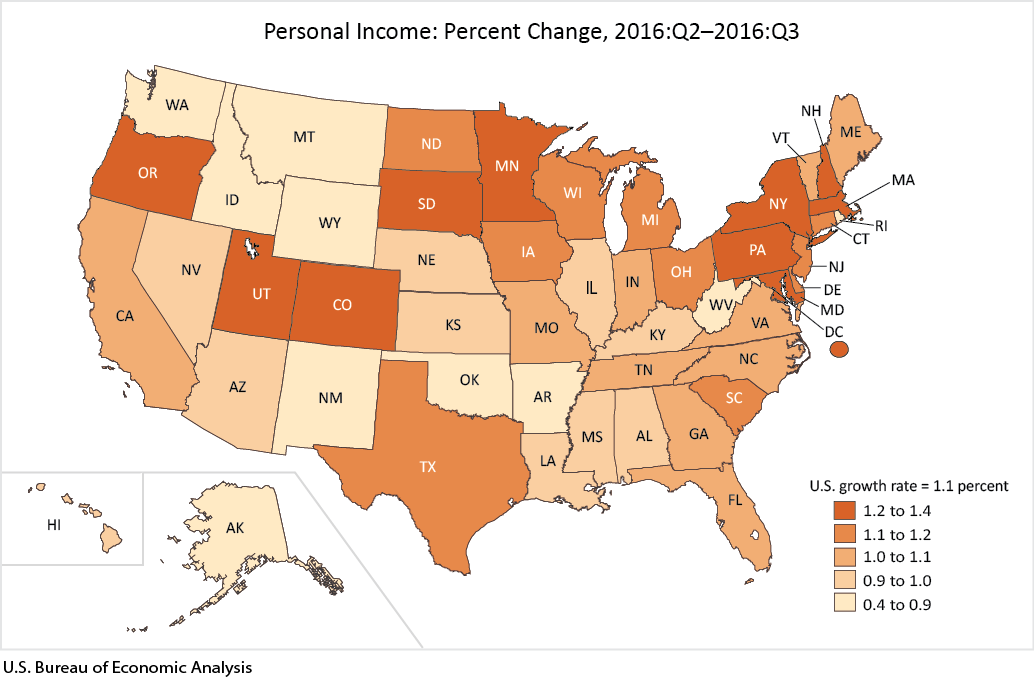
State personal income growth decelerated to 1.1 percent on average in the third quarter of 2016 from 1.2 percent in the second quarter, according to estimates released today by the U.S. Bureau of Economic Analysis. Personal income grew in every state in the second-quarter with growth rates ranging from 0.4 percent in Oklahoma to 1.4 percent in South Dakota (table 1).
Earnings. Earnings increased 1.3 percent in the third quarter of 2016 and was the leading contributor to growth in personal income in most states (table 2).

Both personal income and earnings grew faster in South Dakota than in any other state. Growth in farm earnings and in finance and insurance earnings were the leading contributors to the 1.8 percent growth in total earnings (table 3).
The next fastest growing states were Pennsylvania, Minnesota, Massachusetts, and Oregon where personal income grew 1.3 percent.
- In Pennsylvania, growth in health care and social assistance earnings and in professional, scientific, and technical services earnings were the leading contributors to the 1.4 percent growth in total earnings.
- In Minnesota, growth in health care and social assistance earnings and in finance and insurance earnings were the leading contributors to the 1.6 percent growth in total earnings.
- In Massachusetts, growth in professional , scientific, and technical services earnings and in finance and insurance earnings were the leading contributors to the 1.5 percent growth in total earnings.
- In Oregon, growth in state and local government earnings and in professional, scientific, and technical services earnings were the leading contributors to the 1.7 percent growth in total earnings.
For the nation, earnings grew in 22 of the 24 industries for which BEA prepares quarterly estimates (table 5). Growth in professional, scientific, and technical services; health care and social assistance; and finance and insurance were the leading contributors to overall growth in personal income.
Mining earnings fell 1.4 percent nationally in the third quarter, the eighth consecutive quarterly decline. Lower mining earnings contributed to below average earnings and personal income growth in the five slowest growing states: Montana, New Mexico, West Virginia, Wyoming and Oklahoma. In Montana, the leading contributor to slower income growth was the health care and social assistance industry where earnings declined in the third quarter after bonuses were paid in the second quarter. In West Virginia and Oklahoma, declines in state and local government earnings were the leading contributors to slower income growth.
Updates to Personal Income. Today, BEA also released revised quarterly personal income estimates for 2016:Q1 to 2016:Q2. Revisions were made to incorporate source data that are more complete and more detailed than previously available, and to align the states with revised national estimates.
Next release: March 28, 2017 at 8:30 A.M. EDT – State Personal Income: Fourth Quarter 2016 and Preliminary Annual 2016.
Additional Information
Resources
- Stay informed about BEA developments by reading the BEA blog, signing up for BEA's email subscription service, or following BEA on Twitter @BEA_News.
- Historical time series for these estimates can be accessed in BEA's Interactive Data Application.
- Access BEA data by registering for BEA's Data Application Programming Interface (API).
- For more on BEA's statistics, see our monthly online journal, the Survey of Current Business.
- BEA's news release schedule.
- BEA Regional Facts (BEARFACTS), a narrative summary of personal income, per capita personal income, and components of income for each state.
- Complete information on the sources and methods for the estimation of BEA's State Personal Income and Employment.
Definitions
Personal income is the income received by, or on behalf of, all persons from all sources: from participation as laborers in production, from owning a home or business, from the ownership of financial assets, and from government and business in the form of transfers. It includes income from domestic sources as well as the rest of world. It does not include realized or unrealized capital gains or losses.
Per capita personal income is calculated as the total personal income of the residents of a state divided by the population of the state. In computing per capita personal income, BEA uses mid-quarter population estimates based on unpublished Census Bureau data.
Earnings:
Earnings by place of work is the sum of wages and salaries, supplements to wages and salaries, and proprietors’ income. BEA’s industry estimates are presented on an earnings by place of work basis.
Net earnings by place of residence is earnings by place of work less contributions for government social insurance, plus an adjustment to convert earnings by place of work to a place-of-residence basis. BEA presents net earnings on an all industry level.
Property income is rental income of persons, personal dividend income, and personal interest income.
Personal current transfer receipts are benefits received by persons from federal, state, and local governments and from businesses for which no current services are performed. They include retirement and disability insurance benefits (mainly Social Security), medical benefits (mainly Medicare and Medicaid), income maintenance benefits, unemployment insurance compensation, veterans' benefits, and federal education and training assistance.
Personal income is measured before the deduction of personal income taxes and other personal taxes and is reported in current dollars (no adjustment is made for price changes).
The estimate of personal income for the United States is the sum of the state estimates and the estimate for the District of Columbia; it differs slightly from the estimate of personal income in the national income and product accounts (NIPAs) because of differences in coverage, in the methodologies used to prepare the estimates, and in the timing of the availability of source data.
Statistical Conventions
Quarter-to-quarter percent changes are calculated from unrounded data and are not annualized. Quarterly estimates are expressed at seasonally adjusted annual rates, unless otherwise specified. Quarter-to-quarter dollar changes are differences between published estimates.
BEA Regions
BEA groups all 50 states and the District of Columbia into eight distinct regions for purposes of data collecting and analyses: New England (Connecticut, Maine, Massachusetts, New Hampshire, Rhode Island, and Vermont); Mideast (Delaware, District of Columbia, Maryland, New Jersey, New York, and Pennsylvania); Great Lakes (Illinois, Indiana, Michigan, Ohio, and Wisconsin); Plains (Iowa, Kansas, Minnesota, Missouri, Nebraska, North Dakota, and South Dakota); Southeast (Alabama, Arkansas, Florida, Georgia, Kentucky, Louisiana, Mississippi, North Carolina, South Carolina, Tennessee, Virginia, and West Virginia); Southwest (Arizona, New Mexico, Oklahoma, and Texas); Rocky Mountain (Colorado, Idaho, Montana, Utah, and Wyoming); and Far West (Alaska, California, Hawaii, Nevada, Oregon, and Washington).
Uses of State Personal Income Statistics
State personal income statistics provide a framework for analyzing current economic conditions in each state and can serve as a basis for decision making. For example:
- Federal government agencies use the statistics as a basis for allocating funds and determining matching grants to states. The statistics are also used in forecasting models to project energy and water use.
- State governments use the statistics to project tax revenues and the need for public services.
- Academic regional economists use the statistics for applied research.
- Businesses, trade associations, and labor organizations use the statistics for market research.
List of News Release Tables
Table 1. Personal Income, by State and Region
Table 2. Personal Income Change by Component, by State and Region
Table 3. Contributions of Earnings to Percent Change in Personal Income by Industry, State and Region
Table 4. Earnings Growth by Industry, State and Region
Table 5. Earnings Growth Rates by Industry, State and Region