Videos and Visuals
See our latest charts, maps and other visuals for a different look at BEA data. Watch our videos to learn about BEA’s economic indicators, navigating the website and interactive database, submitting a survey through eFile, and more.
Latest visuals
Visuals featured on our Twitter feed along with links to the source data.

U.S. Travel Exports in 2015
Source Data
Consumer Spending on Bakery Products
Source Data
Transportation and Warehousing Growth in Q2 2016
Source Data
Health Care and Social Assistance Growth in Q2 2016
Source Data
Consumer Spending on Goods and Services in October
Source Data
Spending on Treatment for Diseases and Medical Conditions
Source Data
Consumer Spending on Sugars and Sweets
Source Data
State Per Capita Consumer Spending on Health Care
Source Data
State Per Capita Consumer Spending on Housing and Utilities
Source Data
State Per Capita Consumer Spending on Groceries
Source Data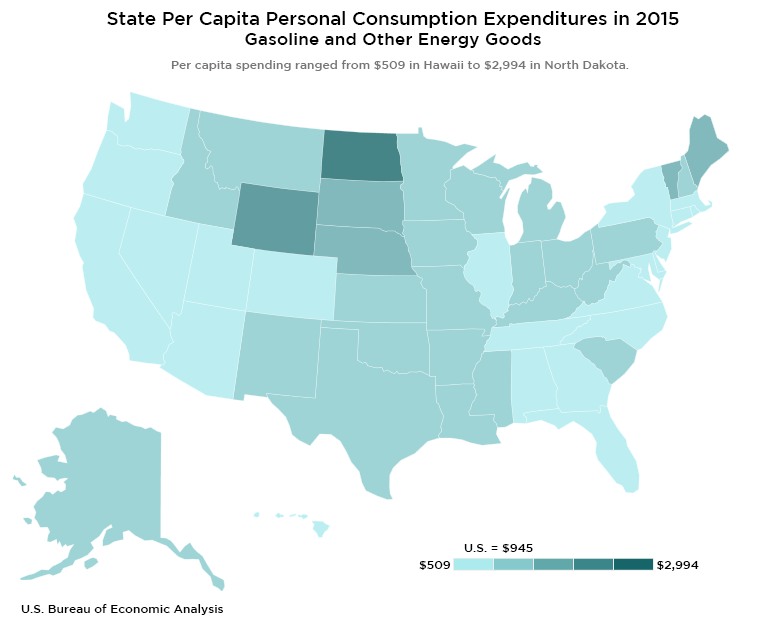
State Per Capita Consumer Spending on Gasoline and Other Energy Goods
Source Data
GDP and Ten Fastest-Growing Metro Areas in 2015
Source Data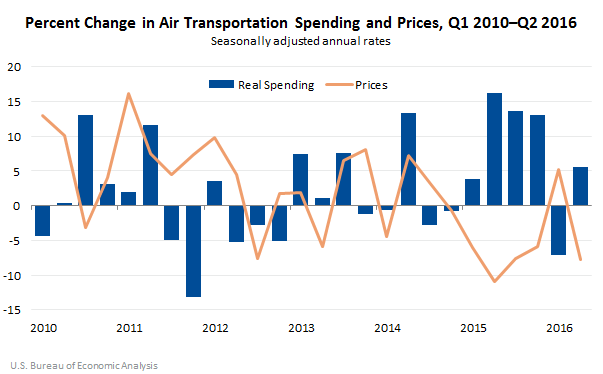
Percent Change in Air Transportation Spending and Prices in Q2 2016
Source Data
Percent Change in Travel and Tourism Spending and Prices in Q2 2016
Source Data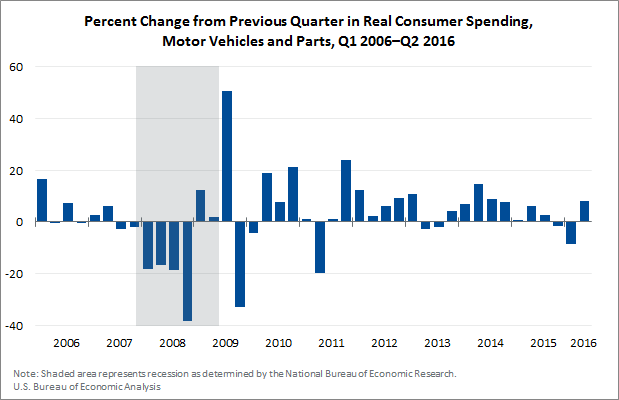
Consumer Spending on Autos
Source Data
Regional Price Parities for Metro Areas in 2014
Source Data
Price Indexes for Personal Consumption Expenditures
Source Data
Real Gross Output by Industry in Q1 2016
Source Data
Foreign Direct Investment and U.S. Businesses in 2015
Source Data
Percent Change in Real Personal Income in Metro Areas
Source Data
Real Spending on Passenger Air Transportation
Source Data
Earnings Growth Rates by State in Q1 2016
Source DataLatest videos
- BEA introduces beaR
- August 28, 2016
- Why Do Old GDP Numbers Change?
- August 5, 2016
- GDP Increases in First Quarter
- June 28, 2016
- Real gross domestic product (GDP) increased 1.1 percent in the first quarter of 2016, according to the “third” estimate released by the Bureau of Economic Analysis.
- Real Disposable Personal Income and Real Consumer Spending
- June 29, 2016
- Inflation-adjusted consumer spending moderates in May after a big increase the month before. http://go.usa.gov/x3rYd
Economic indicators
- GDP Increases in First Quarter
- June 28, 2016
- Real gross domestic product (GDP) increased 1.1 percent in the first quarter of 2016, according to the “third” estimate released by the Bureau of Economic Analysis.
- Real Disposable Personal Income and Real Consumer Spending
- June 29, 2016
- Inflation-adjusted consumer spending moderates in May after a big increase the month before. http://go.usa.gov/x3rYd
- Real Value Added by Industry
- July 23, 2015
- BEA News
- U.S. Current-Account Balance and Its Components
- June 18, 2015
- BEA News
- U.S International Trade in Goods and Services
- June 3, 2015
- BEA News
- First-Quarter GDP Revised Down
- May 29, 2015
- BEA News
- Real Consumer Spending Increased in March
- April 30, 2015
- BEA News
- Quarter-to-Quarter Growth in Real GDP
- April 29, 2015
- BEA News
- Real Value Added by Industry
- April 23, 2015
- BEA News
- Real Value Added by Industry
- March 13, 2015
- BEA News
- Arts and Culture as a Share of the Overall Economy
- April 8, 2015
- BEA News
BEA on TV and radio
- A Look at Foreign Direct Investment
- SEP 9, 2016
- Patricia Abaroa talked about foreign direct investment in the United States and its impact on the United States’ and Connecticut’s economies in a series of radio interviews for the Connecticut Business and Industry Association’s annual economic conference.
- How Consumers Are Faring Across States
- AUG 22, 2014
- Ian Mead and Mark Hamrick talked about two reports from the Bureau of Economic Analysis on U.S. household spending and economic wellbeing through the recession of the late 2000s and the subsequent recovery. They also spoke about the amount consumers spend by state and the quarterly statistics on the economic activity generated by each state.
- Washington Journal
- How America's Industries Impact the U.S. Economy
- MAY 16, 2014
- Erich Strassner of the U.S. Bureau of Economic Analysis and Gregory Ip of The Economist discuss a government report that analyzes gross domestic product (GDP) for 22 industry sectors on a quarterly basis.
- Washington Journal
- A Look at GDP and Ways to Measure Well-Being
- APR 28, 2014
- Gross domestic product, the total dollar value of goods and services sold in the U.S., has become fundamental to American economic policy. But there are other essential assets, qualities and conditions that GDP can't measure, like the health of the environment or society. Economics correspondent Paul Solman looks at another way of measuring progress that takes more of these variables into account.
- PBS NewsHour
- New Quarterly Industry Statistics
- APR 17, 2014
- Beginning April 25, BEA for the first time will start producing on a regular basis quarterly estimates of economic activity generated by 22 industries.
- Consumer Spending Habits
- DEC 27, 2013
- Nicole Mayerhauser and Jim Tankersley talked about the history of American consumers' spending habits on goods and services. Topics included the effect on the gross domestic product and the economy overall, personal income and the savings rate, changes in consumer buying habits, and changes in consumer behavior since the recession of 2008-09. They responded to telephone calls and electronic communications.
- This program was part of C-SPAN’s regular Friday “America by the Numbers” series.
- What is the origin of GDP?
- JUL 31, 2013
- Steve Landefeld, director of the Commerce Department's Bureau of Economic Analysis, explains how the GDP became the most important measure of economic growth and how it has evolved.
- Arts and entertainment now part of GDP act
- JUL 31, 2013
- The Commerce Department is now including creations in arts and entertainments industries -- such as books, music, and movies -- to calculate the nation's GDP. Using this formula, the GDP actually grew 2.8 percent last year, not the 2.2 percent that was originally reported. Anthony Mason reports.
- Myths and Misperceptions about the U.S. Economy
- MAR 29, 2013
- Ryan Avent and Steve Landefeld talked about perceptions, misconceptions and myths about the U.S. economy. Topics included tax rates, federal spending and the debt, wages and income, off-shore and foreign ownership, and the nation’s economic standing in the world. They responded to telephone calls and electronic communications.
- Supplemental Information: View the slides from the broadcast
- This program was part of C-SPAN’s regular Friday “America by the Numbers” series.
- 2012 Earnings for Americans
- FEB 1, 2013
- Brent Moulton and Neil Irwin talked about the 2012 earnings report, the government’s first look at how much Americans earned, spent and saved in 2012, trends in personal income, spending and savings, and how Americans have fared since the recession of 2008-09. He also talked about how the government’s fiscal, tax and social policies have affected Americans' financial well-being.
- Supplemental Information: View the slides from the broadcast
- This program was part of C-SPAN’s regular Friday “America by the Numbers” series.
Finding economic data
- How to find:
GDP per capita by Metro Area
- JAN 28, 2013
- Investigative Reporters and Editors Conference | San Antonio, TX
- How to find:
Compensation
- JAN 28, 2013
- Investigative Reporters and Editors Conference | San Antonio, TX
Using the interactive tables
- Introduction to the BEA Interactive Data Application
- JAN 28, 2013
- Bureau of Economic Analysis video showcasing the new interactive tables design and functionality.
Filing a BEA survey
- BE-13 Survey Overview
- DEC 10, 2014
- How to Report Acquisitions and Mergers on the BE-13 Survey?
- DEC 10, 2014
- How to Report New Establishments on the BE-13 Survey?
- DEC 10, 2014
- How to Report Expansions on the BE-13 Survey?
- DEC 11, 2014
- Do I Need to File a BE-13 Claim for Exemption Form?
- DEC 11, 2014
- Questions about foreign owners?
- APR 24, 2013
- Selecting an Industry Code on the BE-12 and BE-15 Surveys
- APR 18, 2013
Creating maps and charts with BEA data
- BEA’s Chart Tool
- March 27, 2014
- BEA’s Mapping Tool
- Mar 27, 2014