Maps and Data - AFV Acquisitions by Regulated Fleets (by Fuel Type)
Find maps and charts showing transportation data and trends related to alternative fuels and vehicles.
OR
Sort by:
130 results
-
Fuels & Infrastructure: Fuel Trends
-
-
Average Annual Retail Fuel Price of Gasoline
Trend of gasoline prices, real and nominal from 1949-2014 Last update August 2015
-
-
-
Average Retail Fuel Prices in the U.S.
Trend of alternative and traditional motor fuel prices from 2000-2016 Last update December 2016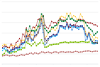
-
-
-
Consumption of Natural Gas in the U.S.
U.S. natural gas consumption by different end uses in 2015 Last update September 2016
-
-
-
Crude Oil Imported to the U.S. by Country of Origin
Quantity of U.S. oil imports by country of production from 1973-2014 Last update August 2015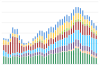
-
-
-
Estimated Consumption of Alternative Fuels by AFVs
Trends of alternative fuel consumption in AFVs by fuel type from 1992-2011 Last update June 2014
-
-
-
Fuel Taxes by Country
Comparison of gasoline and diesel taxes in Organization for Economic Co-operation and Development countries Last update September 2016
-
-
-
Global Ethanol Production
Quantity of ethanol produced by country from 2007-2014 Last update March 2016
-
-
-
Transportation Energy Use by Mode and Fuel Type
Amount of fuel consumed by different transportation modes Last update September 2014
-
-
-
Transportation Fuel Use by Mode
Percentage of fuel used by various transportation modes in the U.S. Last update April 2016
-
-
-
U.S. Biodiesel Production, Exports, and Consumption
Trend of U.S. biodiesel production, exports, and consumption from 2001-2015 Last update September 2016
-
-
-
U.S. Consumption of Ethanol and MTBE Oxygenates
Trend of ethanol and MTBE consumption as oxygenates and gasohol blends from 1978-2014 Last update April 2016
-
-
-
U.S. Production, Consumption, and Trade of Ethanol
Trend of total ethanol fuel production and consumption from 1981-2015 Last update September 2016
-
-
-
U.S. Production, Consumption, and Trade of Petroleum Products
Trend of total petroleum product production, consumption, and trade from 1949-2014 Last update August 2015
-
-
Fuels & Infrastructure: Alternative Fueling Stations
-
-
ARRA Electrification Projects
Last update November 2012
-
-
-
BioFuels Atlas
BioFuels Atlas is an interactive map for comparing biomass feedstocks and biofuels by location. This tool helps users select from and apply biomass data layers to a map, as well as query and download biofuels and feedstock data. The state zoom function summarizes state energy use and infrastructure for traditional and bioenergy power, fuels, and resources. The tool also calculates the biofuels potential for a given area. BioFuels Atlas was developed by the National Renewable Energy Laboratory with funding from the DOE Biomass Program.
-
-
-
Daily Truck Freight Tons
Last update February 2013
-
-
-
TransAtlas
TransAtlas is an interactive map that uses a Google Maps interface to display: Existing and planned alternative fueling stations Alternative fuel production facilities Light-duty vehicle density Roads and political boundaries Users can customize the map display and print and query the underlying data. TransAtlas is part of a suite of geographic analysis tools for renewable energy developed at the National Renewable Energy Laboratory.
-
-
-
U.S. Alternative Fueling Stations by Fuel Type
Download station data for a variety of alternative fuels. Last update September 2016
-


AFV Acquisitions by Regulated Fleets (by Fuel Type)
| 1992 | 1993 | 1994 | 1995 | 1996 | 1997 | 1998 | 1999 | 2000 | 2001 | 2002 | 2003 | 2004 | 2005 | 2006 | 2007 | 2008 | 2009 | 2010 | 2011 | 2012 | 2013 | 2014 | 2015 | |
| Hydrogen | 0 | 0 | 0 | 0 | 0 | 0 | 0 | 0 | 0 | 0 | 1 | 0 | 0 | 1 | 7 | 0 | 2 | 1 | 3 | 0 | 0 | 0 | 9 | 0 |
| CNG | 11 | 1637 | 2617 | 3513 | 2322 | 2208 | 1890 | 3029 | 3811 | 3400 | 2679 | 1937 | 1662 | 627 | 563 | 713 | 354 | 233 | 390 | 496 | 618 | 1224 | 1228 | 891 |
| E85 | 0 | 102 | 92 | 185 | 474 | 1734 | 2103 | 3499 | 8452 | 5973 | 6319 | 5401 | 5646 | 8667 | 12082 | 14212 | 20623 | 10694 | 9618 | 13681 | 17353 | 19922 | 18700 | 19274 |
| LNG | 0 | 0 | 2 | 0 | 3 | 0 | 0 | 1 | 0 | 1 | 0 | 0 | 0 | 1 | 0 | 4 | 5 | 0 | 0 | 0 | 0 | 0 | 0 | 0 |
| Propane | 0 | 560 | 1281 | 1603 | 1641 | 1545 | 1351 | 731 | 1370 | 865 | 961 | 564 | 607 | 48 | 17 | 7 | 10 | 19 | 5 | 1 | 21 | 8 | 0 | 4 |
| Methanol (M85) | 0 | 132 | 56 | 23 | 130 | 579 | 401 | 149 | 0 | 0 | 0 | 0 | 0 | 0 | 0 | 0 | 0 | 0 | 0 | 0 | 0 | 3 | 0 | 0 |
| Electric | 16 | 52 | 171 | 117 | 56 | 251 | 372 | 595 | 349 | 392 | 353 | 376 | 155 | 92 | 151 | 220 | 239 | 137 | 265 | 318 | 208 | 194 | 403 | 592 |
Source: National Renewable Energy Laboratory EPAct State and Alternative Fuel Provider Fleet Task
Under the Energy Policy Act of 1992 (EPAct) and subsequent regulations, certain vehicle fleets operated by state agencies or alternative fuel providers are required to acquire alternative fuel vehicles (AFVs) as a fraction of their light duty vehicle fleet. This chart shows the number of AFV acquisitions these fleets made from 1992 through 2015. Flex fuel vehicles that operate on high-level blends of ethanol continue to be the most frequently acquired vehicle. This is likely because they can conveniently be refueled on gasoline when ethanol is not available and because vehicle manufacturers offer the flex fuel option on the models most frequently acquired by fleets. Furthermore, the marginal cost increase of acquiring a flex fuel vehicle over a conventional gasoline vehicle is minimal or nonexistent.
Print