Maps and Data
Find maps and charts showing transportation data and trends related to alternative fuels and vehicles.
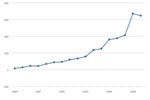
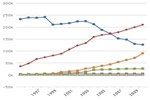
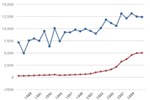
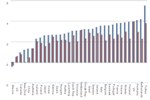
Clean Cities Annual Petroleum Savings
| 1994 | 1995 | 1996 | 1997 | 1998 | 1999 | 2000 | 2001 | 2002 | 2003 | 2004 | 2005 | 2006 | 2007 | 2008 | 2009 | 2010 | 2011 | |
| Million GGEs Displaced | 14.661601 | 26.257135 | 44.636261 | 42.601614 | 67.430476 | 86.992812 | 92.062378 | 119.179912 | 132.560577 | 156.05423 | 233.3 | 250 | 360 | 375 | 412 | 670 | 645 | 805 |
Source: Clean Cities annual coalition reports, 2004-2011.
Notes: Savings are measured in gasoline-gallon equivalents (GGEs), representing a quantity of fuel with the same amount of energy contained in a gallon of gasoline.
This chart shows the petroleum savings achieved through Clean Cities activities from 1994 through 2011.