Maps and Data
Find maps and charts showing transportation data and trends related to alternative fuels and vehicles.
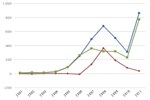
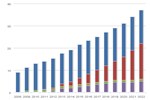
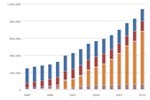
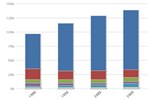
Clean Cities Cumulative Petroleum Savings
| 1994 | 1995 | 1996 | 1997 | 1998 | 1999 | 2000 | 2001 | 2002 | 2003 | 2004 | 2005 | 2006 | 2007 | 2008 | 2009 | 2010 | 2011 | |
| Cumulative | 0.014661601 | 0.040918736000000004 | 0.085554997 | 0.128156611 | 0.195587087 | 0.282579899 | 0.374642277 | 0.493822189 | 0.6263827660000001 | 0.782436996 | 1.015736996 | 1.265736996 | 1.625736996 | 2.000736996 | 2.412736996 | 3.082736996 | 3.727736996 | 4.533 |
Source: Clean Cities annual metrics reports, 2004-2011.
Notes: Savings are measured in gasoline-gallon equivalents (GGEs), representing a quantity of fuel with the same amount of energy contained in a gallon of gasoline.
This chart shows Clean Cities' cumulative petroleum savings over the life of the program. Since its inception in 1994, Clean Cities has saved more than 4 billion gallons of petroleum.