Maps and Data
Find maps and charts showing transportation data and trends related to alternative fuels and vehicles.
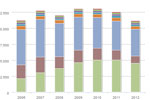
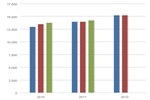
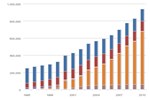
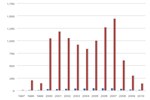
Light-Duty Vehicles Sold in the U.S.
| 1975 | 1976 | 1977 | 1978 | 1979 | 1980 | 1981 | 1982 | 1983 | 1984 | 1985 | 1986 | 1987 | 1988 | 1989 | 1990 | 1991 | 1992 | 1993 | 1994 | 1995 | 1996 | 1997 | 1998 | 1999 | 2000 | 2001 | 2002 | 2003 | 2004 | 2005 | 2006 | 2007 | 2008 | 2009 | 2010 | 2011 | |
| Cars | 7.274 | 8.685 | 10.027 | 10.018 | 9.727 | 8.774 | 7.935 | 7.007 | 7.066 | 9.672 | 9.807 | 10.136 | 9.923 | 10.122 | 9.558 | 8.434 | 8.158 | 7.8 | 7.971 | 8.055 | 9.011 | 7.622 | 8.037 | 7.722 | 8.12 | 8.826 | 7.961 | 7.86 | 7.442 | 6.982 | 7.305 | 7.179 | 7.473 | 6.75 | 5.061 | 5.601 | 6.062 |
| Wagons | 0.963 | 1.037 | 1.273 | 1.157 | 1.067 | 0.669 | 0.798 | 0.812 | 0.936 | 1.003 | 0.983 | 0.878 | 0.808 | 0.613 | 0.461 | 0.376 | 0.366 | 0.307 | 0.486 | 0.36 | 0.385 | 0.268 | 0.298 | 0.25 | 0.259 | 0.302 | 0.447 | 0.444 | 0.509 | 0.556 | 0.722 | 0.815 | 0.612 | 0.579 | 0.501 | 0.457 | 0.491 |
| Vans | 0.457 | 0.502 | 0.514 | 0.625 | 0.481 | 0.242 | 0.245 | 0.311 | 0.383 | 0.676 | 0.855 | 1.044 | 1.114 | 1.133 | 1.278 | 1.262 | 1.034 | 1.221 | 1.441 | 1.418 | 1.662 | 1.409 | 1.266 | 1.489 | 1.463 | 1.691 | 1.233 | 1.243 | 1.232 | 0.953 | 1.481 | 1.166 | 0.847 | 0.79 | 0.368 | 0.559 | 0.552 |
| SUVs | 0.187 | 0.243 | 0.283 | 0.38 | 0.401 | 0.185 | 0.136 | 0.162 | 0.289 | 0.625 | 0.736 | 0.774 | 0.873 | 0.968 | 0.926 | 0.708 | 1.095 | 1.003 | 1.311 | 1.623 | 1.816 | 1.89 | 2.45 | 2.581 | 2.831 | 3.143 | 3.45 | 4.191 | 4.118 | 4.713 | 4.084 | 3.757 | 4.231 | 3.987 | 2.315 | 3.218 | 3.517 |
| Pickups | 1.343 | 1.866 | 2.026 | 2.268 | 2.207 | 1.437 | 1.44 | 1.441 | 1.628 | 2.043 | 2.078 | 2.532 | 2.147 | 2.459 | 2.232 | 1.835 | 1.92 | 1.84 | 2.002 | 2.669 | 2.271 | 1.955 | 2.408 | 2.415 | 2.545 | 2.613 | 2.519 | 2.381 | 2.475 | 2.506 | 2.301 | 2.188 | 2.113 | 1.794 | 0.989 | 1.276 | 1.744 |
This chart shows the number and types of light-duty vehicles sold in the United States from 1975 to 2011. In 2005, cars made up the smallest share of the total, relative to all other years. In 2009, U.S. light-duty vehicle sales were significantly impacted by the Great Recession. In 2010, sales rebounded to nearly 14 million. For comparison, see On-Road AFVs Made Available by Year, and U.S. HEV Sales by Model.