Maps and Data
Find maps and charts showing transportation data and trends related to alternative fuels and vehicles.
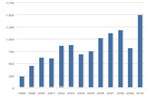
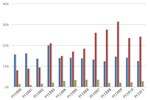
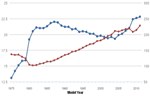
Efficiency and Power of U.S. Light-Duty Vehicles Over Time
| 1975 | 1976 | 1977 | 1978 | 1979 | 1980 | 1981 | 1982 | 1983 | 1984 | 1985 | 1986 | 1987 | 1988 | 1989 | 1990 | 1991 | 1992 | 1993 | 1994 | 1995 | 1996 | 1997 | 1998 | 1999 | 2000 | 2001 | 2002 | 2003 | 2004 | 2005 | 2006 | 2007 | 2008 | 2009 | 2010 | 2011 | |
| Avg. Fuel Economy | 13.1 | 14.2 | 15.1 | 15.8 | 15.9 | 19.2 | 20.5 | 21.1 | 21 | 21 | 21.3 | 21.8 | 22 | 21.9 | 21.4 | 21.2 | 21.2 | 20.8 | 20.9 | 20.4 | 20.5 | 20.4 | 20.1 | 20.1 | 19.7 | 19.8 | 19.6 | 19.4 | 19.6 | 19.3 | 19.9 | 20.1 | 20.6 | 21 | 22.4 | 22.6 | 22.8 |
| Avg. Peak Horsepower | 137 | 135 | 136 | 129 | 124 | 104 | 102 | 103 | 107 | 109 | 114 | 114 | 118 | 123 | 129 | 135 | 138 | 145 | 147 | 152 | 158 | 164 | 169 | 171 | 179 | 181 | 187 | 195 | 199 | 211 | 209 | 213 | 217 | 219 | 208 | 214 | 228 |
Source: Environmental Protection Agency (EPA) Table 1 and 2.
Notes: Fuel economy reflects a weighted combination of the standard EPA highway drive cycle (55%) and city drive cycle (45%).
EPA adjusted the fuel economy figures to reflect real road conditions rather than lab conditions.
This chart shows trends in horsepower and fuel efficiency in U.S. light-duty vehicles from 1975 to 2011. Horsepower steadily increased from 1980 through 2008, and was used for greater acceleration and powering larger vehicles at the expense of fuel economy. Following oil price shocks and supply disruptions in 1974, 1979, and 2008, fuel efficiency improved markedly as consumers sought to curb fuel costs. Fuel efficiency declined from the late 1980s through the mid-2000s, partly due to the rise in popularity of light trucks (including trucks, SUVs, and vans) as passenger vehicles. See also Composition of U.S. Light-Duty Fleet by Vehicle Type Over Time.