|
Total construction activity for March 2009 ($969.7 billion) was 0.3 percent above the revised February 2009 ($967.1 billion). Please see our web site for further details: http://www.census.gov/constructionspending
|
Current
0.3
% change
March 2009
|
Previous
-1.0
% change
February 2009
|
- Current Press Release:
-
 PDF PDF
-
 XLS
XLS
|
|
- Released: May 4, 2009
- Next release: June 1, 2009
- Frequency: Monthly
- Program Overview
|
| |
|
New orders for manufactured goods in March decreased $3.2 billion or 0.9 percent to $345.3 billion.
|
Current
-0.9
% change
March 2009
|
Previous
0.7
% change
February 2009
|
- Current Press Release:
-
PDF
-
XLS
|
|
- Released: May 1, 2009
- Next release: June 3, 2009
- Frequency: Monthly
- Program Overview
|
| |
|
Homeownership Rate (HR)
The homeownership rate (67.3 percent) for the current quarter was lower than the rate in first quarter 2008 (67.8 percent), but not statistically different from the rate in fourth quarter 2008
(67.5 percent).
Rental Vacancy Rate (RVR)
The rental vacancy rate in first quarter 2009 (10.1 percent) was not statistically different from the first quarter 2008 rate (10.1 percent).
Homeowner Vacancy Rate (HVR)
The homeowner vacancy rate in first quarter 2009 (2.7 percent) was lower than the first quarter 2008 rate (2.9 percent).
|
Current
67.3
percent
1st Qtr 2009
(HR)
|
Previous
67.8
percent
1st Qtr 2008
(HR)
|
- Current Press Release:
-
PDF
-
|
|
- Released: April 27, 2009
- Next release: July 24, 2009
- Frequency: Quarterly
|
| |
|
Sales of new one-family houses in March 2009 were at a seasonally adjusted annual rate of 356,000. This is 0.6% below the revised February 2009 estimate of 358,000.
|
Current
-0.6
% change
March 2009
|
Previous
+8.2
% change
February 2009
|
- Current Press Release:
-
PDF
-
XLS
|
|
- Released: April 24, 2009
- Next release: May 28, 2009
- Frequency: Monthly
- Program Overview
|
| |
|
New orders for manufactured durable goods in March decreased $1.3 billion or 0.8 percent to $161.2 billion.
|
Current
-0.8
% change
March 2009
|
Previous
2.1
% change
February 2009
|
- Current Press Release:
-
PDF
-
XLS
|
|
- Released: April 24, 2009
- Next release: May 28, 2009
- Frequency: Monthly
- Program Overview
|
| |
|
Privately-owned housing starts in March 2009 were at a seasonally adjusted annual rate of 510,000. This is 10.8 percent below the revised February 2009 estimate of 572,000.
|
Current
-10.8
% change
March 2009
|
Previous
+17.2
% change
February 2009
|
- Current Press Release:
-
PDF
-
XLS
|
|
- Released: April 16, 2009
- Next release: May 19, 2009
- Frequency: Monthly
- Program Overview
|
| |
|
U.S. total business sales for February were $994.9 billion, up 0.2% from last month. Month-end inventories were $1,421.3 billion, down 1.3% from last month.
|
Current
0.2
% Change in sales
Feburary 2009
|
Previous
-1.0
% Change in sales
January 2009
|
|
|
|
- Released: April 14, 2009
- Next release: May 13, 2009
- Frequency: Monthly
- Program Overview
|
| |
|
U.S. retail and food service sales for March reached $344.4 billion, a decrease of 1.1 percent from the previous month.
|
Current
-1.1
% change
March 2009
|
Previous
+0.3
% change
February 2009
|
|
|
|
- Released: April 14, 2009
- Next release: May 13, 2009
- Frequency: Monthly
- Program Overview
|
| |
|
The Nation's international deficit in goods and services decreased to $26.0 billion in February 2009 from $36.2 billion in January, as exports increased and imports decreased.
|
Current
-26.0
$ billion
February 2009
|
Previous
-36.2
$ billion
January 2009
|
|
|
|
- Released: April 9, 2009
- Next release: May 12, 2009
- Frequency: Monthly
- Program Overview
|
| |
|
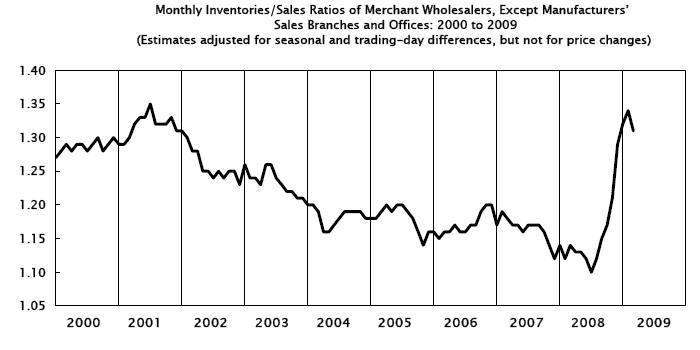
February 2009 sales of merchant wholesalers were $319.7 billion, up 0.6 percent from last month. End-of-month inventories were $419.3 billion, down 1.5 percent from last month.
|
Current
-1.5
% change in Inv
February 2009
|
Previous
-0.9
% change in Inv
January 2009
|
- Current Press Release:
-
PDF
-
XLS
|
|
- Released: April 8, 2009
- Next release: May 8, 2009
- Frequency: Monthly
- Program Overview
|
| |
|
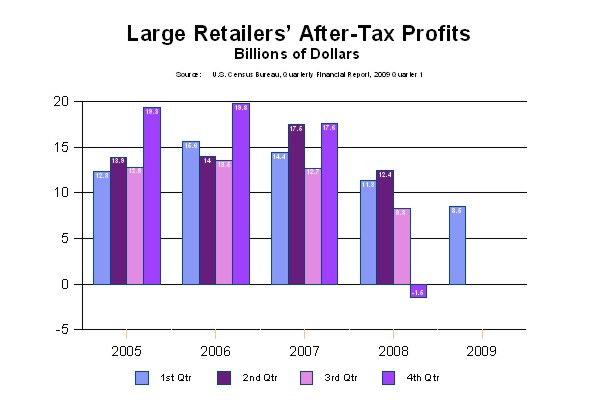
After-tax profits for retail corporations with assets greater than $50 million averaged 1.2 cents per dollar of sales for the fourth quarter 2008 (the 3 months ending Jan. 31, 2009), down 0.5 (+/- 0.1) cents from the average of 1.6 cents for the third quarter 2008 (the 3 months ending Oct. 31, 2008).
|
Current
-0.5
cents
4th Qtr. 2008
|
Previous
-0.7
cents
3rd Qtr. 2008
|
- Current Press Release:
-
PDF
-
XLS
|
|
- Released: March 30, 2009
- Next release: June 22, 2009
- Frequency: Quarterly
- Program Overview
|
| |
|
Manufacturing corporations' seasonally adjusted after-tax losses averaged 3.3 cents per dollar of sales for the fourth quarter of 2008, down 10.5 (+/- 0.2) cents from the after-tax profits average of 7.2 cents for the third quarter of 2008.
|
Current
-10.5
cents
4th Qtr 2008
|
Previous
+1.1
cents
3rd Qtr 2008
|
- Current Press Release:
-
PDF
-
XLS
|
|
- Released: March 30, 2009
- Next release: June 15, 2009
- Frequency: Quarterly
- Program Overview
|
| |
|
U.S. Information sector revenue for the fourth quarter of 2008, adjusted for seasonal variation but not for price changes, was $278.9 billion, a decrease of 1.2 percent (+/- 0.5) from the third quarter of 2008.
|
Current
-1.2
% change
4th Qtr 2008
|
Previous
-0.4
% change
3rd Qtr 2008
|
- Current Press Release:
-
PDF
-
XLS
|
|
- Released: March 11, 2009
- Next release: June 10, 2009
- Frequency: Quarterly
|
| |


