|
Summary Table: Prevention – Diet
|
|
Only one measure per topic is displayed in the summary table. A complete set of measures, where they exist, can be found in the report.
| Trend key: |
 |
solid green - headed in the right direction |
| |
 |
dotted red - headed in the wrong direction |
| |
 |
dashed black - stable
or non-significant change (NSC) |
| |
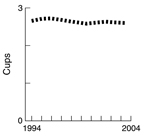
Fruit and vegetable consumption
1994-2004 |
Red meat consumption
1994-2004 |
Fat consumption
1989-2004 |
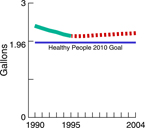
Alcohol consumption
1990-2004 |
| Measure |
Average daily cups of fruits and vegetables for people ages 2 and older. (Note: This measure includes fruits and vegetables from all sources. One serving is approximately ½ cup.) |
Average daily ounces of red meat consumed by individuals aged 2 years and older. (Note: Red meat includes beef, lamb, and pork from all sources and does not include processed poultry.) |
Total fat Intakes as a percentage of total calories. |
Annual per capita alcohol consumption in gallons by individuals aged 14 years and older. |
| Trend |
NSC, then stable, then NSC
 |
NSC, then stable, then NSC, then stable
 |
Falling, then stable
 |
Falling, then rising
 |
| Desired direction |
Rising  |
Falling  |
Falling |
Falling |
| Most recent estimate |
In 2003–2004, people aged 2 and older had, on average, 1 cup of fruits and 1.6 cups of vegetables, for a total of 2.6 cups of fruits and vegetables. |
In 2003-2004, people ages 2 and older had, on average, 2.5 ounces of red meat per day. |
Data collected in 2003-2004 show that total fat made up one-third (33 percent) of the calories people consumed, a level within the recommendations of the Dietary Guidelines. |
In 2002, per capita alcohol consumption was 2.23 gallons for all beverages, including beer, wine, and liquor. |
| Healthy People 2010 target |
There is no target for fruits and vegetables combined. The individual targets are: at least two daily servings of fruits; at least three daily servings of vegetables, with at least one-third being dark-green/orange |
There is no Healthy People 2010 target for red meat consumption. |
Consume no more than 30 percent of daily calories from fat. |
Reduce annual per capita alcohol consumption to 2 gallons. |
| More information |
|
|
|
|