Swath Bathymetry systems
 Submetrix Training Pack, 2000, v. 1.10 |
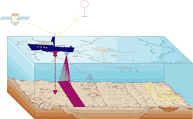
A "swath-sounding" sonar system is one that is used to measure the depth in a line extending outwards from the sonar transducer. systems acquire data in a swath at right angles to the direction of motion of the transducer head. As the head moves forward, these profiles sweep out a ribbon-shaped surface of depth measurement, known as a swath.
 |
| Schematic showing the transducer as an aqua box on the sidemount. The acoustic energy pathway is shown by the fan-shaped set of purple rays fan out with increasing distance from the transducer (ship). The area of the sea floor that is ensonified is depicted by the solid-purple swath. |
|---|
Current swath sounding systems utilize two differing technologies to achieve bathymetry measurements across a “swath” of the sea floor: 1) Beam forming (multibeam echo sounders), and 2) interferometric or phase discrimination sonars. Both of these techniques have their merits, however the same end results are achieved.
Multibeam echo sounders (MBES) collect bathymetric soundings in a swath perpendicular to the ship track by electronically forming a series of transmit and receive beams in the transducer hardware which measure the depth to the sea floor in discrete angular increments or sectors across the swath (Hughes-Clarke, J.E., Mayer, L.A., and Wells, D.E., 1996). Various transmit frequencies are utilized by different MBES systems depending on the sea floor depth. For example, low frequency (12 kHz) systems can collect swath soundings at full ocean depths, many up to 10,000 meters. In contrast, high frequency MBES systems (300+ kHz) are utilized for collecting swath bathymetry in depths of 20 meters or less.
In contrast, the term “interferometry” is generally used to describe swath-sounding sonar techniques that use the phase content of the sonar signal to measure the angle of a wave front returned from a sonar target. When backscattered sound energy is received back at the transducer, the angle the return ray of acoustic energy makes with the transducer is measured. The range is calculated from two-way travel time. The angle is determined by knowing the spacing between elements within the transducer, the phase difference of the incoming wavefront, and the wavelength (Submetrix 2000 Series Training Pack, 2000, Submetrix Ltd., Bath, U.K.).
System Operation
The Sea-floor Mapping group operates an interferometric sonar system that is a phase-discrimination wide-swath sonar system. It is a two-channel system that can be outfitted with one of two transducers; one relatively lower frequency system (117 kHz) for deep water, up to 200 m. depth, and another (234 kHz) for shallow water depths, less than 50 m. The system simultaneously collects bathymetric and backscatter data, with swath ranges roughly seven times water depth.
Shipboard monitoring of the bathymetric data in real time is an important part of survey operations, not only for data quality control, but also to assist in underway scientific decision making.
 |
| Monitor displaying real-time swath bathymetry collected offshore South Carolina aboard the R/V Atlantic Surveyor,2003. |
|---|
System Usage
The Sea-floor Mapping group collects bathymetric data acquired with the interferometric sonar system in lacustrine, nearshore, and continental shelf environments. The data are integrated with co-registered sidescan-sonar, subbottom, and sample data.
Bathymetric data were collected offshore South Carolina from 1999 to 2003 and was the first use of the interferometric sonar system. The images below show the morphology and acoustic character of the inner shelf and shoreface of South Carolina from North Inlet to Winyah Bay.
 |
| Composite bathymetry offshore Myrtle Beach, South Carolina. |
|---|
The blow-up depicted in the rectangle shows a subset of the bathymetric data in a perspective. An elongate topographic high lying oblique to the shoreline, which corresponds to a region of low-backscatter within the sidescan imagery (see below) is identified as a sand body, a potentially important deposit in coastal erosion and resource management considerations.
 |
| Composite sidescan sonar data offshore Myrtle Beach, South Carolina. Onshore, the light tan represents land, green is wetlands, and the darker tan, forested wetland. High backscatter = light tones; low backscatter = dark tones |
|---|
A geophysical study of Bear Lake, Utah-Idaho was conducted in 2003, utilizing sidescan-sonar, subbottom profilers, and the interferometric sonar. This was the first high-resolution bathymetric survey and sidescan-sonar survey (with 100% lakebed coverage) of the lake. Data yielded new interpretations as to active faults and sublacustrine springs.
References
Baldwin, W.E., Morton, R.A., Denny, J.F., Dadisman, S.V., Schwab, W.C., Gayes, P.T., and Driscoll, N.W., 2004, Maps showing the stratigraphic framework of South Carolina's Long Bay from Little River to Winyah Bay, U.S. Geological Survey Open-File Report 2004-1013.
Denny, J.F. and S.M. Colman, 2003, Geophysical surveys of Bear Lake, Utah-Idaho, September 2002, USGS Open File Report 03-150, CD-ROM.
Hughes-Clarke, J.E., Mayer, L.A., and Wells, D.E., 1996, Shallow-water imaging multibeam sonars: A new tool for investigating sea floor processes in the coastal zone and on the continental shelf. Marine Geophysical Researches, 18: 607-629.
Submetrix 2000 Series Training Pack, 2000, Submetrix Ltd., Bath, U.K.


