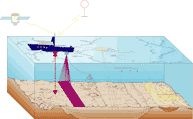
The Woods Hole Science Center (WHSC) has single beam and interferometric sonar systems for bathymetric surveying (measuring water depth).
In single beam systems, an acoustic pulse is emitted from a transducer and propagated in a single, narrow cone of energy directed downward toward the sea floor. providing a single depth measurement for a location directly beneath the ship. The transducer(s) then “listens” for the reflected energy from the sea floor. Water depth is calculated by using the travel time of the emitted pulse. How long did it take the sound wave to travel from the transducer, to the sea floor, and back (i.e. two-way travel time)? Two-way travel time is multiplied by the speed of sound in the ambient water and divided by two. The individual values of depth to the sea floor are subsequently contoured to generate bathymetric maps.
With interferometric sonar systems, the acoustic energy is propagated from the transducer downward in a beam that is narrow in the along-track dimension and wide in the across-track dimension. This method produces a line of depth measurements across-track, i.e. perpendicular to the research vessel’s trackline. As the vessel moves forward, these profiles sweep out a ribbon-shaped surface of depth measurement, known as a swath.
When the outgoing acoustic energy reaches the sea floor, it “ensonifies” an area of the sea floor perpendicular the ship’s line of travel, scattering the sound in many directions. Some of the scattered sound energy is reflected back to the transducers mounted on the ship.
Depth measurements from Interferometric systems are obtained by measuring the angle of the incoming sound signal in addition to the range. Interferometric sonar systems require three or more linear arrays of transducer elements, or staves, one to transmit acoustic energy and at least two to receive the returning signal (Submetrix Training Manual, SEA Advanced Products Ltd., Bath, England). By contrast, the sidescan sonar systems operated by WHSC transmit and receive on the same array of transducers. The WHSC interferometric sonar configuration has 4 linear staves mounted parallel to each other that make up each transducer head. The distances between the staves have been carefully chosen by the manufacturer to obtain optimal measurements of the depth of the sea floor across the swath using the principles of interferometry. One stave is used to transmit the acoustic signal, and all four are used to “listen” for the returning wavefront.
 |
| Deployment of the interferometric sonar configured on a sidemount from the R/V Atlantic Surveyor, offshore South Carolina during a USGS research cruise in 2001. |
|---|
The interferometric sonar system measures depth using both the travel time of the emitted pulse and the angle the returning sound energy makes with each linear array or stave. The times it takes for the returning wavefront to reach each stave are acquired simultaneously by the topside electronics which, knowing the speed of sound in water, can be used to determine a range to the sea floor at a given instance in time. Knowing the time lag of the returning signal relative to each stave, and by comparing the phase content of the incoming signal at each stave relative to the others, this information can then be used to calculate the angle between the direction of the acoustic signal and the transducer head. The angle and range pairs of data make it possible to determine the exact location from which the scattered returning energy originated.
The WHSC has two interferometric transducers, one operating at 117 kHz, and the other at 234 kHz. The lower frequency transducer has greater range, but less resolution. The higher frequency transducer has less range, but greater resolution.


