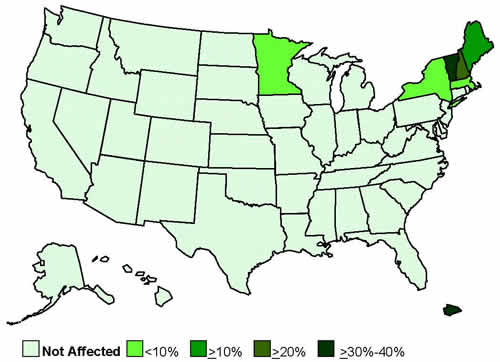
Health Centers
Potentially Affected Under Proposed New
Designation Guidelines
[D]
* On March 31, 2008, HRSA updated its
analysis of the proposed regulation using
the most current health center data available,
2006. Based on this analysis, at most,
only 16 out of 1,001 health center grantees
(1.6%) would have to include state or
local data to seek to maintain their current
designation status.
| State/Territory |
Grantees |
Designated |
Percent
Designated |
State/Local
Data Required |
Percent
Requiring State/Local Data |
Alabama |
15 |
15 |
100%
|
0
|
0%
|
Alaska |
24 |
24 |
100%
|
0
|
0%
|
American
Samoa |
1 |
1 |
100%
|
0
|
0%
|
Arizona |
14 |
14 |
100%
|
0
|
0%
|
Arkansas |
12 |
12 |
100%
|
0
|
0%
|
California |
103 |
103 |
100%
|
0
|
0%
|
Colorado |
15 |
15 |
100%
|
0
|
0%
|
Connecticut |
10 |
10 |
100%
|
0
|
0%
|
Delaware |
4 |
4 |
100%
|
0
|
0%
|
District
of Columbia |
4 |
4 |
100%
|
0
|
0%
|
Federated
States of
Micronesia |
2 |
2 |
100%
|
0
|
0%
|
Florida |
38 |
38 |
100%
|
0
|
0%
|
Georgia |
24 |
24 |
100%
|
0
|
0%
|
Guam |
1 |
1
|
100%
|
0
|
0%
|
Hawaii |
13 |
13 |
100%
|
0
|
0%
|
Idaho |
10 |
10 |
100%
|
0
|
0%
|
Illinois |
34 |
34 |
100%
|
0
|
0%
|
Indiana |
15 |
15 |
100%
|
0
|
0%
|
Iowa |
11
|
11
|
100%
|
0
|
0%
|
Kansas |
9
|
9
|
100%
|
0
|
0%
|
Kentucky |
15
|
15
|
100%
|
0
|
0%
|
Louisiana |
20
|
20
|
100%
|
0
|
0%
|
Maine |
17
|
15
|
88%
|
2
|
12%
|
Marshall
Islands |
1
|
1
|
100%
|
0
|
0%
|
Maryland |
14
|
14
|
100%
|
0
|
0%
|
Massachusetts |
33
|
31
|
94%
|
2
|
6%
|
Michigan |
28
|
28
|
100%
|
0
|
0%
|
Minnesota |
14
|
13
|
93%
|
1
|
7%
|
Mississippi |
22
|
22
|
100%
|
0
|
0%
|
Missouri |
19
|
19
|
100%
|
0
|
0%
|
Montana |
12
|
12
|
100%
|
0
|
0%
|
Nebraska |
5
|
5
|
100%
|
0
|
0%
|
New
Hampshire |
9
|
7
|
78%
|
2
|
22%
|
New
Jersey |
18
|
18
|
100%
|
0
|
0%
|
New
Mexico |
14
|
14
|
100%
|
0
|
0%
|
Nevada |
2
|
2
|
100%
|
0
|
0%
|
New
York |
47
|
46
|
98%
|
1
|
2%
|
North
Carolina |
24
|
24
|
100%
|
0
|
0%
|
North
Dakota |
4
|
4
|
100%
|
0
|
0%
|
Ohio |
23
|
23
|
100%
|
0
|
0%
|
Oklahoma |
11
|
11
|
100%
|
0
|
0%
|
Oregon |
22
|
22
|
100%
|
0
|
0%
|
Palau |
1
|
1
|
100%
|
0
|
0%
|
Pennsylvania |
31
|
31
|
100%
|
0
|
0%
|
Puerto
Rico |
20
|
14
|
70%
|
6
|
30%
|
Rhode
Island |
8
|
8
|
100%
|
0
|
0%
|
South
Carolina |
21
|
21
|
100%
|
0
|
0%
|
South
Dakota |
6
|
6
|
100%
|
0
|
0%
|
Tennessee |
23
|
23
|
100%
|
0
|
0%
|
Texas |
49
|
49
|
100%
|
0
|
0%
|
Utah |
11
|
11
|
100%
|
0
|
0%
|
Vermont |
5
|
3
|
60%
|
2
|
40%
|
Virginia |
21
|
21
|
100%
|
0
|
0%
|
Virgin
Islands |
2
|
2
|
100%
|
0
|
0%
|
Washington |
23
|
23
|
100%
|
0
|
0%
|
West
Virginia |
27
|
27
|
100%
|
0
|
0%
|
Wisconsin |
15
|
15
|
100%
|
0
|
0%
|
Wyoming |
5
|
5
|
100%
|
0
|
0%
|
| TOTAL |
1,001
|
985
|
98.4%
|
16
|
1.6%
|
posted 4-22-08
|