Electric Power Monthly September 2008 Edition
Report Released: October 03, 2008
Next Release Date: Mid-November 2008
Executive Summary
Generation: Data from the National Oceanic and Atmospheric Administration (NOAA) show that much of the United States experienced warmer than normal temperatures in June 2008. With the warmer weather, NOAA’s Residential Energy Demand Temperature Index was the sixth highest June value on record. According to the Federal Reserve, the manufacturing component of its industrial production index was 1.6 percent higher than it was in June 2007 and the total index was 1.4 percent higher. All of this contributed to a net generation total in June 2008 that was 2.9 percent or 10.5 million MWh higher than June 2007.
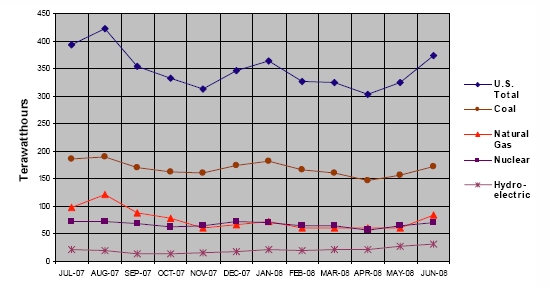
Coal generation in June 2008 was 1.6 percent lower than it was in June 2007. Net generation from conventional hydroelectric sources, however, was 34.7 percent higher as generation totals were significantly higher in Washington, Oregon, and California. At Grand Coulee, the largest power plant in the United States, net generation was 66.4 percent higher in June 2008 than it had been the previous June. Net generation attributable to nuclear sources was 2.0 percent higher than the year before. Natural gas-fired generation was 3.6 percent higher than its June 2007 level. (Figure 1). Petroleum liquid-fired generation was 10.6 percent lower compared to a year ago, with its overall share of net generation still quite small compared to coal, nuclear, natural gas-fired, and hydroelectric sources. Wind-powered generation was 81.6 percent higher than it was in June 2007. Even with this significant increase, the contribution of wind-powered generation to the national total was only 1.2 percent in June 2008.
Figure 1: Net Generation by Major Energy Source: Total (All Sectors), July 2007 through June 2008 |
 |
Year-to-date, net generation was up 1.0 percent over 2007 levels. Net generation attributable to coal-fired plants increased by 0.8 percent Nuclear generation was down 0.5 percent. Generation from petroleum liquids was down 42.9 percent, while natural gas-fired generation was up 4.4 percent. With the higher June totals, conventional hydroelectric generation year-to-date was up 3.3 percent.
Year-to-date wind generation was up 47.8 percent due primarily to increased generation in Texas and Colorado. Together, these States accounted for 57.5 percent of the year-to-date national rise in wind generation.
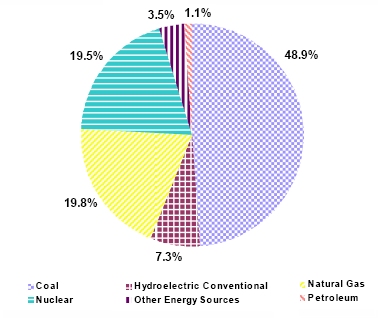
Coal-fired plants contributed 48.9 percent of the Nation’s electric power, year-to-date. Nuclear plants contributed 19.5 percent, while 19.8 percent was generated at natural gas-fired plants. Of the 1.1 percent generated by petroleum-fired plants, petroleum liquids represented 0.8 percent, with the remainder from petroleum coke. Conventional hydroelectric power provided 7.3 percent of the total, while other renewables (primarily biomass, but also geothermal, solar, and wind) and other miscellaneous energy sources generated the remaining electric power (Figure 2).
| Figure 2: Net Generation Shares by Energy Source: Total (All Sectors), Year-to-Date through June, 2008 |
 |
Consumption of Fuels: Consumption of coal for power generation in June 2008 was down by 0.8 percent compared to June 2007. For the same time period, consumption of petroleum liquids and petroleum coke decreased by 11.2 percent and 17.5 percent, respectively, while the consumption of natural gas increased by 1.1 percent.
Year-to-date, consumption of coal increased by 1.0 percent. Natural gas consumption decreased by 0.8 percent, while the consumption of petroleum liquids and petroleum coke decreased by 43.3 percent and 15.6 percent, respectively.
Fuel Stocks, Electric Power Sector, June 2008
Total electric power sector coal stocks decreased between June 2007 and June 2008 by 2.4 million tons. Stocks of bituminous coal (including coal synfuel) decreased by 12.1 million tons comparing June 2007 to June 2008 (from 75.8 to 63.7 million tons). Subbituminous coal stocks grew by 10.3 million tons between June 2007 and June 2008 (from 75.5 to 85.8 million tons).
Petroleum liquid stocks at the end of June 2008 were 3.5 million barrels lower than they were in June 2007. Electric power sector liquid petroleum stocks totaled 41.0 million barrels at the end of June 2008, 7.8 percent lower than the level at the end of June 2007, and 0.1 percent (32 thousand barrels) lower than at the end of May 2008.
Fuel Receipts and Costs, All Sectors, June 2008
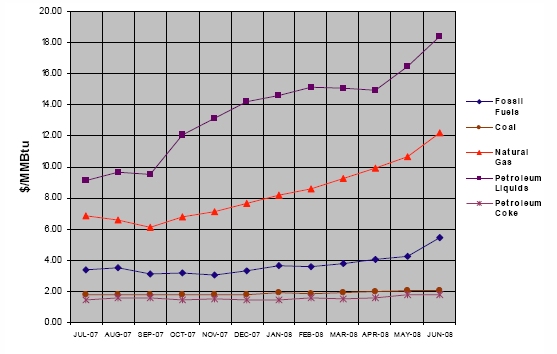
During June 2008, as was the case in the previous month, the prices of all three categories of fossil fuels (coal, petroleum, and natural gas) reached an all-time high (in nominal dollars) (Figure 3). June petroleum liquids and natural gas receipts increased over the previous month, while coal receipts declined.
The price of petroleum liquids in June continued the sharply rising trend that began when prices jumped from $9.55 per MMBtu in September 2007 to $12.07 per MMBtu in October. The average price paid for petroleum liquids was $18.37 per MMBtu in June 2008, an 11.7-percent increase when compared with the $16.44 per MMBtu price in May, and an 86.1-percent increase when compared with June 2007. The price of oil to electric power producers is usually in line with the spot price of a barrel of oil in the United States, although the June 2008 increase over June 2007 for electricity producers was almost double the spot price increase. At the end of June 2008, the spot price (FOB weighted by estimated import volume) of a barrel of oil was $128.02, a 5.0-percent increase over May 2008, and a 46.3-percent increase over June 2007. Receipts of petroleum liquids were 7.1 million barrels, a 4.9-percent increase over June 2007 and a 66.9-percent increase from May 2008.
The average price paid for natural gas by electricity generators in June 2008 was $12.21 per MMBtu, a 14.1-percent increase from the May 2008 level of $10.70 per MMBtu. The June 2008 price was 60.7 percent higher than the June 2007 price of $7.60 per MMBtu. Receipts of natural gas were 746.8 billion cubic feet, up 36.0 percent from May 2008, and up 12.8 percent from June 2007.
The average price of coal to electricity generators in June 2008 was $2.09 per MMBtu, up 2.0 percent from May 2008 and up 18.1 percent from the June 2007 price. Receipts of coal were 84.5 million tons, down 3.8 percent when compared with May 2008 and down 7.0 percent from June 2007. The overall price for fossil fuels was $5.46 per MMBtu in June 2008, a 27.6-percent increase from May 2008, and 58.3 percent higher than in June 2007.
Year-to-date (January through June) 2008 prices compared to the same period last year were up 32.7 percent for natural gas and 11.9 percent for coal. Year-to-date 2008 receipts compared to the same period last year were up 10.7 percent for natural gas and down 2.6 percent for coal. Year-to-date petroleum liquid receipts were down 25.1 percent, a testimony to the 85.1 percent year-to-date increase in price.
Figure 3: Electric Power Industry Fuel Costs, July 2007 through June 2008 |
 |
Sales, Revenue, and Average Retail Price, June 2008
The average retail price of electricity for June 2008 was 10.33 cents per kilowatthour (kWh), 8.9 percent higher than May 2008 when the average retail price of electricity was 9.49 cents per kWh and 9.1 percent higher than June 2007. An increase in electricity demand due to higher-than-normal temperatures for the month led to an increase of 2.5 percent in retail sales between June 2007 and June 2008. The average price of residential electricity for June 2008 increased to 11.80 cents per kWh, up from 11.43 cents per kWh in May 2008. At 11.80 cents per kWh, the average residential price of electricity increased by 6.6 percent from June 2007. The increases in the retail electricity prices are influenced by the increases in fossil fuel prices.
Sales: For June 2008, sales in the residential and commercial sectors increased by 3.8 and 2.9 percent, respectively, while sales in the industrial sector increased by only 0.1 as compared to June 2007. For the month, total retail sales were 329.3 billion kWh, an increase of 38.2 billion kWh from May 2008, and an increase of 8.0 billion kWh from June 2007. Year-to-date 2008, sales were 1,828.9 billion kWh, corresponding to a 2.1 percent increase over the same period in 2007.
Revenue: Total retail revenues in June 2008 were $34.0 billion, reflecting an increase in revenue of 11.7 percent over June 2007. The data suggest that the revenue increase was related to higher fuel costs. Total retail revenues for June 2008 increased by $6.4 billion from May 2008 reflecting the similar comparison of sales for that time frame. For June 2008, residential sector retail revenues increased 10.7 percent over June 2007, while the commercial and industrial sector retail revenues increased by 11.8 and 14.2 percent, respectively. Year-to-date 2008, retail revenue increased to $171.2 billion, a 7.0 percent increase over the same period in 2007.
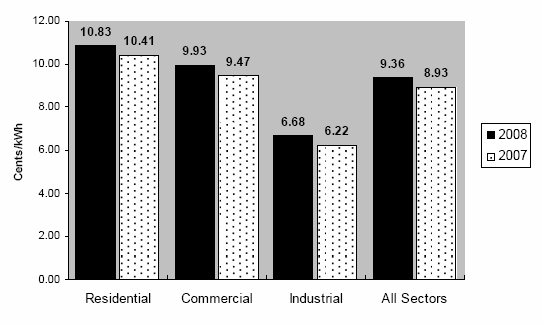
Average Retail Price: For the month, average residential retail prices increased 6.6 percent over June 2007 and 3.2 percent over May 2008. The average commercial and industrial retail prices for June 2008 increased 8.6 percent and 14.0 percent, respectively from the prior year. In June 2008, the average cost of electricity per unit increased to 10.33 cents per kWh from 9.49 cents per kWh in May 2008. Year-to-date 2008, the average residential retail price increased to 10.83 cents per kWh, or 4.0 percent, while the overall average retail price increased to 9.36 cents per kWh, a 4.8 percent increase over the same period in 2007. (Figure 4).
| Figure 4: Average Retail Price of Electricity to Ultimate Customers by End-Use Sector, Year-to-Date through June 2008 and 2007 |
 |
Contacts:
Coordinator -
Generation -
Consumption -
Fuel Stocks -
Fuel Receipts, Cost, and Quality -
Sales, Revenue, and Average Retail Price of Electricity -
(entire report also available in printer-friendly format
|
||||||||||||||||||||||||||||||||||||||||||||||||||||||||||||||||||||||||||||||||||||||||||||||||||||||||||||||||||||||||||||||||||||||||||||||||||||||||||||||||||||||||||||||||||||||||||||||||||||||||||||||||||||||||||||||||||||||||||||||||||||||||||||||||||||||||||||||||||||||||||||||||||||||||||||||||||||||||||||||||||||||||||||||||||||||||||||||||||||||||||||||||||||||||||||||||||||||||||||||||||||||||||||||||||||||||||||||||||||||||||||||||||||||||||||||||||||||||||
|
||||