Chapter 5: Exposure Evaluation: Evaluating Environmental Contamination
- (Section 5.1) Evaluating Environmental Sampling Data
- (Section 5.2) Evaluating Modeled Data
- (Section 5.3) Considering Background Concentrations
- (Section 5.4) Identifying and Filling Critical Data Gaps
- (Section 5.5) Summarizing and Presenting Environmental Data in the Public Health Assessment
An important component of the exposure assessment process is the evaluation of environmental contamination using available environmental sampling data and, in some cases, modeling studies. You must understand environmental contamination to conduct exposure pathway analyses (see Chapter 6) and determine appropriate exposure point concentrations for health effects evaluations (see Chapters 7 and 8).(1) The following two questions are critical when evaluating environmental contamination data:
- Are the available site data—whether measured or modeled—of sufficient quality and quantity to evaluate the exposure pathways?
- If critical data gaps are identified, how should they be filled?
By considering the above questions, you can determine whether the available data for a site accurately and sufficiently reflect exposure conditions, and you can avoid basing important public health decisions on unreliable data or asking for additional data that do not fill critical data gaps.
This chapter will help you answer the questions listed above. Specifically, Section 5.1 describes how you can evaluate the usability of environmental sampling data; Section 5.2 provides guidelines for interpreting modeled data; Section 5.3 indicates how you should consider "background" levels of contamination in your assessment; Section 5.4 lists several approaches for identifying and filling data gaps; and Section 5.5 suggests how you can compile and summarize environmental data in public health assessment documents. Refer to Chapters 6, 7, and 8 for how health assessors should interpret environmental contamination data in drawing public health conclusions and recommending actions to protect public health.
For reference, the text box below describes how the environmental data evaluation fits into the larger public health assessment process.
Environmental Contamination Data: Environmental data help characterize possible exposures and are therefore one of the four primary data inputs for the public health assessment process, along with exposure data, health effects data, and community concerns. Health assessors should evaluate the quality and usability of all environmental data, whether measured or modeled, before using them in the public health assessment process. This chapter provides guidance on how to evaluate environmental contamination, but remember that these evaluations are conducted to support other parts of the health assessment process, including the following: Analysis of exposure pathways: An important task in the public health assessment process is determining whether people are exposed to contamination, because public health hazards (other than physical hazards) cannot exist if exposure does not occur. Environmental data indicate when and where contamination has been detected—insights that are useful for evaluating exposure pathways. Chapter 6 describes the elements of exposure pathways in greater detail. Health effects evaluation: Many different factors determine whether public health hazards will result from exposure. Critical questions to ask are: to what contaminants were people exposed? at what levels? and for how long? Environmental contamination data assist in addressing these questions, and Chapters 6, 7, and 8 describe how to identify substances and pathways of potential concern and how to interpret the environmental contamination data in a public health context. |
5.1 Evaluating Environmental Sampling Data
Environmental sampling data indicate the levels of contaminants in water, soil, air, and food chain (biota). ATSDR strongly prefers to base public health conclusions on environmental sampling data rather than modeled data, since they often are direct measurements of exposure point concentrations. Because they are essential inputs to the public health assessment process, you need to understand how to evaluate sampling data. Unfortunately, no single formula or prescribed approach exists for data evaluation, and the level and extent of data review needed often varies from site to site. However, some fundamental concepts apply to most data evaluation exercises.
Though the individual sections that follow present important considerations for evaluating environmental sampling data, you should remember that your ultimate goal in these evaluations is to determine what data you can and cannot use for a public health assessment. This should be something that you consider in all steps of your data evaluations.
5.1.1 Background Information on Environmental Sampling
Before evaluating the validity and representativeness of environmental sampling data, you should first become familiar with the scope and goals of a site's environmental sampling projects. Because different parties collect environmental samples for different reasons, the quality of environmental data for a given site can vary widely from one sampling project to the next. Therefore, having some general background information about the type of sampling conducted is an important first step in evaluating data.
Sampling studies used to support public health assessments can vary widely in scope and purpose, and therefore have varied data quality objectives (DQOs). In many cases, you will use whatever data are available, even those that were collected in programs not designed for public health evaluations. Regardless of the scope of the individual sampling programs, you should realize that sampling techniques generally fall into one of the following four categories, which have significant bearing on how data are interpreted:
- Field Screening Techniques. Sampling teams usually rely on field screening
techniques to obtain real-time indications of levels of contamination. This is
typically done during the preliminary site investigations of hazardous waste sites.
Examples of field screening techniques include chemical test kits, organic vapor
analyzers, Drager tubes, ion-specific probes, and other portable monitoring
equipment. These techniques help field personnel quickly identify the presence of
certain contaminants and maybe even areas of relatively high and relatively low
contamination. Their outputs, however, often are of limited quality and reliability
in terms of precise quantitation and specificity, as the following examples show:
Certain surveying devices report measured concentrations as ranges (e.g.,
"between 50 and 100 [parts per billion]"), rather than reporting actual
concentration; other devices report concentrations of groups of substances, rather
than for individual compounds (e.g., "total VOCs in air at 2.0 ppm [parts per
million]"); and other techniques have relatively high detection limits (see text box
below), which often limits their utility in environmental public health evaluations.
Though such observations may be useful for planning more refined sampling programs, they generally are not useful for generating rigorous measures of chemical-specific environmental contamination. Therefore, you should rely on data generated by field screening techniques only when data from more advanced sampling approaches (see below) are not available. In such cases, recommending additional sampling may be appropriate, as described in Section 5.4.
Detection Limits: By definition, the detection limit is the lowest level of a contaminant that analytical equipment can discern from the "noise" inherent to scientific measurements. When laboratories report that a contaminant was not detected in a sample, that does not mean that the contaminant was not present. Rather, it means the contaminant was not present at levels that can be reliably measured by the analytical method, and the only conclusion that you can draw is that the actual concentration is somewhere between zero and the reported detection limit. In statistical analyses of environmental sampling data, therefore, a common practice is to replace nondetect observations with surrogate concentrations of one-half the detection limit. Health assessors need to be wary of how detection limits compare to appropriate health-based comparison values, which Section 7.1 describes in greater detail. If an analytical method has detection limits for a contaminant higher than the corresponding comparison values, the method is not sensitive enough to measure concentrations of potential concern. In such a case, a "nondetect" result will not tell you if concentrations are above or below a comparison value, and further sampling using more sensitive methods might be necessary to evaluate the levels of contamination at the range of interest. |
- Field Laboratory Techniques. Sampling teams typically use field laboratory
techniques when data quality objectives demand quick reporting of reliable data
that cannot be generated by available field screening techniques. Quick turnaround of sampling results may be necessary in many circumstances, such as
to evaluate whether an acute health hazard exists during site remediation. Field
laboratory techniques include a broad suite of applications, but most rely on
collecting samples at a site and immediately analyzing them in an on-site mobile
laboratory. An example of a commonly used technique is a mobile gas
chromatography and mass spectrometry (GC/MS) unit, which can generate highly
precise and accurate data at concentrations lower than many field screening
techniques can.
Field laboratory techniques can produce data that meet data quality objectives if proper quality control procedures are used (EPA 1992a). In some cases, however, environmental regulators may request that site investigators have a subset of samples analyzed by both the field laboratory and a stationary laboratory—a step that can help gauge the accuracy of the measurements made in the field. You should carefully review quality control procedures of these sampling techniques (see Section 5.1.2) before using data from field laboratories in a public health assessment.
- Stationary Laboratory Techniques. For sampling projects designed to generate data of a known and high quality, site investigators usually collect samples in the field and then ship them to stationary laboratories for analysis (i.e., laboratories in fixed buildings and not mobile units). These laboratories are generally capable of analyzing samples for many more substances than can be identified by other techniques. Moreover, by following detailed quality assurance/quality control (QA/QC) protocols, these laboratories can produce data that EPA deems to be "legally defensible" and usable for its site-specific human health risk assessments (EPA 1992a).
- Unspecified Techniques. It is not uncommon for health assessors to uncover environmental sampling records that do not indicate exactly how samples were collected and analyzed. For instance, you may find a page of groundwater concentrations in an EPA site file but no supporting information on the depth of the well or the specific analytical methods used to measure concentrations. Or you may access data collected in the early 1970s, prior to when many laboratories routinely used and documented all aspects of quality control. In these instances, you can present and discuss such data in a public health assessment, but you should acknowledge the limitations of the data—primarily that the data may be inaccurate and are of questionable quality.
For Superfund site investigations, site investigators are typically required to generate data using stationary laboratories in EPA's Contract Laboratory Program (CLP). This subset of stationary laboratories must adhere to specific data quality criteria, such that the data produced under this program are of known analytical quality. Where possible, you should seek out CLP-quality or equivalent data; only use CLP or equivalent data in public health assessments after conducting a brief review of the QA/QC information (see Section 5.1.2).
In summary, stationary laboratory techniques tend to generate data of a higher quality than field laboratory techniques, which tend to generate data of a higher quality than field screening techniques. Though generally true, this rule has many exceptions. For instance, when stationary laboratories use improper analytical procedures, the data they generate may be no more accurate than those generated by field laboratory techniques. Further, some field measurements are clearly more representative of true environmental conditions than laboratory results (e.g., because the pH of a water sample can change with time, direct field measurements of water pH are usually more representative of actual environmental conditions than laboratory measurements of pH made days later). Due to these and other exceptions, you must take steps to review the validity and representativeness of environmental sampling data. These topics are addressed in Sections 5.1.2 and 5.1.3, respectively.
5.1.2 Validity of Environmental Sampling Data
Environmental sampling is not a perfect science, and many factors can bias sampling results. For instance, surface water samples can have "false positive" results if sampling vials were not cleaned properly before a site investigation, and air samples can have "false negative" results if the sampling canisters leak when being transported between the field and the laboratory or an inappropriate analytical method is used. Given these and a wide range of other potential problems, you should not assume that all environmental sampling data are accurate. Ask yourself: How confident am I that the reported concentrations truly indicate the levels of contamination in the environmental media? Or, more simply: Are the sampling data valid?
Answering this question is not as easy as it may seem. With extensive sampling projects, for example, an exhaustive data validation exercise can take weeks. However, ATSDR's health assessors generally do not conduct such exhaustive evaluations, except possibly in cases where you have reason to believe environmental sampling data are not valid. In general, you should take the basic steps outlined below to have a certain degree of confidence in sampling results before using them in a public health assessment. Should you decide to conduct a more thorough data validation exercise, there are several references that offer detailed guidance on how this should be done.
The resource list at the end of this chapter provides more detailed information about what you may want to know about sampling and analytical methods. EPA's Guidance for Data Useability in Risk Assessment (Part A) (EPA 1992a), for example, presents an extensive discussion of possible sampling strategies, sampling methods, and analytical methods. The discussion of analytical methods includes a listing of available methods for identifying a number of substances commonly found in water, soil, and air. These methods have been approved by EPA for conducting human health risk assessments at Superfund sites.
Conducting a detailed review of sampling practices and data quality (referred to as data validation) requires specialized training and a detailed understanding of data quality concerns. Health assessors generally are not expected to conduct in-depth data validations. You should, however, be familiar with the terms and general methods used to validate data, and you should consult with other team members (e.g., analytical chemists), site investigators, or the laboratory that generated the data to clarify questions you may have related to methods used or data validation documentation.
Three general tips are presented below for how you can gauge the validity of environmental sampling data without conducting a detailed review of data quality. These tips are mere suggestions for helping you assess the validity of the data that you review. For some sites, you may want to examine the validity of data in far greater detail than suggested below.
- Check the sampling and analytical methods. The methods that site investigators use to collect samples and analyze them for concentrations of contaminants have a significant bearing on the validity of sampling data. Specifically, the selected sampling and analytical method usually determines what contaminants can be measured and in what range of concentrations. You should identify the methods used in every site investigation and ensure that they are appropriate for the contaminants reported. If you do not know how to evaluate this type of method, you should ask another member of your team to help you.
- EPA's Office of Air and Radiation has posted numerous documents on
ambient air sampling methods on its "Technology Transfer Network" Web
site (http://www.epa.gov/ttn).
 This site houses EPA's compendium of methods for measuring concentrations of organic compounds, its
compendium of methods for measuring concentrations of inorganic
compounds, and its sampling methods for six priority pollutants.
This site houses EPA's compendium of methods for measuring concentrations of organic compounds, its
compendium of methods for measuring concentrations of inorganic
compounds, and its sampling methods for six priority pollutants.
- EPA's Office of Solid Waste has published an extensive list of methods
for measuring various types of contamination in water, wastes, and soils.
This list of methods—"Test Methods for Evaluating Solid Waste," also
known as SW-846—is also available on-line (http://www.epa.gov/osw).
- EPA has published guidance for sampling levels of contamination in fish
and shellfish, and this guidance also is posted on the Agency's Web site.
- Review data validation documentation. The availability of QA/QC
documentation varies from sampling project to sampling project. Samples that
community members might collect and submit for analysis often do not have
extensive supporting documentation, while those collected for remedial
investigations in the Superfund program often are supported by multiple volumes
of QA/QC information, known as Quality Assurance Program Plans and Data
Validation Reports. In general, data quality documentation addresses field
practices, laboratory practices, QA/QC procedures, and data quality indicators.
Regardless of the volume of information available, you should consider certain
data quality indicators when reviewing the documentation:
- Completeness refers to the fraction of attempted sampling events that have
valid results and is often expressed as a percentage (e.g., 92% of the
samples collected were valid). The completeness of a sampling program is
a rough measure of how successfully it was implemented. A sampling
program with low completeness might result from field or laboratory
personnel having routine problems resulting in a significant number of
samples being invalidated. Such scenarios might cast doubt on the overall
validity of a sampling program.
- Precision in environmental sampling is a measurement of random errors inherent to the process of collecting samples and analyzing them in a laboratory. It is usually quantified by collecting duplicate samples or analyzing samples in replicate. Ideally, concentrations of contaminants in duplicate samples should be equal. In reality, random errors in sampling and analysis almost always cause concentrations in duplicate samples to be different. Highly precise sampling data have relatively low differences in concentrations between duplicate samples; imprecise data, on the other hand, have relatively large differences.
- Accuracy indicates the extent to which measurements represent their corresponding "true" or "actual" value. Site investigators can characterize accuracy in many ways. In some cases, they collect and analyze certified audit samples (i.e., samples with known levels of contamination) and compare them against the measured levels of contamination reported by the analytical laboratory. In other cases, they collect and analyze "blank" samples. When contaminants are detected in the blanks, the sampling results might suffer from a systematic bias introduced by equipment contamination.
- Consult with site investigators, regulators, and technical experts. Many times, the best source of information for assessing the validity of environmental sampling data is the people responsible for collecting and reviewing the data. These individuals often can give insights on the successes and failures of environmental sampling projects. Contacting site investigators and regulators is particularly important in cases where little or no data validation documentation is available.
Now that EPA has published most of its sampling and analytical methods on its
Web site (http://www.epa.gov),![]() this type of evaluation is easier to conduct.
Examples of the clearinghouses of sampling and analytical methods follow:
this type of evaluation is easier to conduct.
Examples of the clearinghouses of sampling and analytical methods follow:
When consulting these sources, you should ensure that the methods used to collect samples have been designed to measure concentrations of those contaminants of particular concern at a site (e.g., those associated with contaminant sources). Also determine whether the detection limits for the method used are low enough to enable an evaluation of health hazards. That is, detection limits generally need to be lower than ATSDR's comparison values (see Chapter 7). Because some comparison values—such as those for hexavalent chromium—are lower than typical background levels or even levels that can be measured with widely used sampling and analytical methods, you will need to determine whether the methods used for those cases are sufficient to evaluate public health hazards.
Precision is usually reported as a relative percent difference (RPD), and most sampling and analytical methods (see Section 5.1.1) specify acceptable ranges of RPDs for environmental sampling. Comparing the reported RPD to these ranges or to a program's data quality objectives should give you insight as to how precise the sampling data are. In some cases, precision may not meet QA/QC criteria, but the data may still be usable for public health assessment purposes. For example, if RPDs in duplicate samples are very different but both measurements are at concentrations considerably lower than ATSDR's comparison values for that substance, obtaining more "precise" data would not be necessary. You may want to consult an analytical chemist, however, when making such judgments.
Regardless of the approaches used, site investigators typically characterize the accuracy of their sampling in data qualifiers reported with the sampling results, and you should review qualifiers carefully and understand what they signify. EPA has published references that describe standard data validation qualifiers in greater detail (EPA 1992a). Where possible, laboratory-specific descriptions of qualifiers should be reviewed because some laboratories might not follow EPA's conventions for reporting qualifiers. The text box on the following page presents important information on data qualifiers and what the most commonly observed ones mean. Consulting with an analytical chemist can help determine whether using a particular set of qualified data is appropriate for your site.
In some cases, you may encounter data that are invalidated (or rejected). These results should be discarded, unless you can justify their use in a scientifically defensible manner. For instance, a laboratory might reject a series of measurements of toluene in soil due to blank contamination. You might find, however, that the measured concentrations—even with the blank contamination—are lower than corresponding health-based comparison values (see Chapter 7). In such a case, you could safely conclude that the amount of toluene in the soil samples is not higher than the health-based comparison value.
The above three steps again are suggestions for how you can assess the validity of environmental sampling data. After conducting your data validation review, you may determine that environmental sampling data indeed suit your needs for understanding levels of contamination at distinct locations. The next step in your evaluation is to examine the representativeness of the environmental sampling data, as described below.
|
||||||||||||
5.1.3 Representativeness of Environmental Sampling Data
You will never review a site that has sampling data that characterize all possible exposures. Typically, the data available for a site characterize levels of contamination at very specific locations and for very specific time frames. A challenge you will face is determining how representative those measured levels of contamination are of other locations and other time frames. Health assessors routinely use their professional judgment to make this determination, erring on the side of caution, and this section provides guidance on how you can do so. In certain cases, however, models are used to estimate levels of contamination at locations that have not been sampled (see Section 5.2) or additional sampling might be recommended (see Section 5.4).
Assessing the representativeness of data is typically a subjective task, which draws from your technical understanding of the fate and transport of environmental contaminants—a topic covered in greater detail in Section 6.3. The following questions, and associated examples, should help guide you in determining whether environmental sampling data (from specific locations and times) can be assumed to be representative of exposure point concentrations (which may be at other locations and other times). These questions should not be viewed as a complete guide for evaluating data representativeness, but rather as examples of the thought process you should go through when interpreting environmental sampling data:
- Were enough samples taken to understand the spatial extent of potential
exposure?
Example: At sites with groundwater contamination, you should ask yourself whether the number and placement of monitoring wells are sufficient for characterizing the spatial extent of contamination to which people are most likely exposed and whether an adequate number of residential and municipal water supply wells have been tested.
- How are contaminants distributed? Are there "hot spots"?
Example: When discharged to rivers, hydrophobic contaminants (e.g., PCBs) tend to accumulate primarily in depositional areas, often resulting in "hot spots." For such sites, you should ask yourself whether sampling locations were selected specifically to identify such areas of elevated contamination.
- Were samples taken in areas most likely impacted by site contamination?
Example: The nearest ambient air monitoring station to a large municipal landfill is approximately 1 mile downwind. You should ask yourself if this proximity is close enough to capture the highest ground-level (or breathing zone) impacts of the landfill's emissions. Knowing that passive releases from landfills tend to have their highest impacts closer to the source would help in such evaluations.
- Were samples collected over time to understand the temporal extent of
contamination?
Example: For an industrial site that has discharged wastewater to a river for 20 years, with surface water monitoring data available only for the last 5 years, you should ask yourself if the recent data are representative of past levels of pollution. Changes in the facility's production levels and wastewater treatment practices over the years would be important to consider.
- Are the sampling data grab samples or long-term sampling efforts?
Example: At some sites, the only environmental data you might find are from a single sampling event, say one air sample collected downwind from a smelter. You should evaluate how representative this one sample is of air quality over the longer term. It is important to remember that lone grab samples only give you a "snapshot" of the overall trends in environmental contamination.
- Is the frequency of sampling adequate to characterize the public health threat?
Example: Methane is often measured in on-site gas monitoring wells at operating landfills on a weekly basis. However, landfill gas concentrations increase or decrease greatly in just a few hours as a result of climate changes. If people live adjacent to the landfill, weekly sampling might not be sufficient to characterize potentially hazardous acute exposures or physical hazards due to explosion.
- What are the measured concentrations at the point of contact?
Example: Sampling from a single municipal water supply well shows elevated levels of chlorinated solvents, but water from this and many other municipal supply wells feeds into a complex distribution system before ever reaching homes. For such scenarios, you should ask yourself how much the water is likely to be diluted before reaching a resident's tap. If concerned about water quality at the tap, you may recommend sampling at that location.
- In what forms were contaminants sampled and analyzed?
Example: When working on a site with extensive electroplating operations, the site owner proposes collecting air samples and analyzing them for chromium. You should ensure that the samples are analyzed for the types of chromium of interest. In this case, analytical methods that can distinguish hexavalent chromium from trivalent chromium should be used. You may also research the electroplating process to determine if any specific metal compounds (rather than the elements themselves) should be identified.
- Based on your knowledge of the site, does the pattern of contamination make
sense?
Example: At a site with air releases of tetrachloroethylene (PCE) from a soil excavation project, you would expect the highest concentrations of PCE to occur in the immediate vicinity of the excavation site and to decay with downwind distance. If concentrations increase with downwind distance, however, you should conduct additional research to understand why. In this case, knowing whether dry cleaners and other sources of PCE are located in the area would help in your evaluation
In addition to the above general concerns, there are numerous media-specific concerns for evaluating the representativeness of sampling data. This is because samples collected in some media might be representative of contamination over very small areas, while other media-specific samples might be representative of contamination over broad ranges. As an example, when evaluating air releases of contaminants from a ground-level source, you would expect to see the highest concentrations of the contaminant in close proximity to the source, with concentrations decreasing considerably with downwind distance. Some air pollutants, on the other hand, are known to have minimal spatial variations over broad ranges: ozone, for instance, forms in the air as a product of photochemical reactions, and its concentrations typically have minimal variations over entire cities.
ATSDR's guidance entitled Environmental Data Needed for Public Health Assessments (ATSDR 1994) identifies media-specific concerns that you need to evaluate when assessing data representativeness. In all cases, you should question how adequately sampling locations represent exposure conditions at points of known or suspected exposure. Key issues, by medium, are highlighted below.
Groundwater
- Were groundwater samples collected in the aquifer of concern?
- Did sampling occur both upgradient and downgradient of the site and upgradient
and downgradient of any groundwater contamination plume?
- Has the temporal and spatial extent of contamination plumes been characterized?
- What is the time frame for sample collection? Had the plume either reached or
passed the well location at the time of sampling?
- Were samples for metals filtered (dissolved) or unfiltered (total)? Unfiltered
samples are preferred for public health assessment purposes.
- What details are provided on how the groundwater sample was collected (e.g.,
water collected during well construction, flushed sample, bailed sample)?
- Is field pH reported? Anomalous field pH may indicate problems with the
monitoring well construction.
- Are seasonal flow or rainfall events affecting contaminant concentrations?
Soil
- Do sampling results characterize contamination in soils of areas with different
land uses (e.g., restricted access areas, roadsides, gardens, farms, residential yards,
parks, playgrounds)?
- At what depths were soils sampled? Soil less than 3 inches deep is considered
surface soil, and soil deeper than 3 inches is considered subsurface soil. Soil
samples representing other depths (e.g., EPA defines surface soil as 0-12 inches
deep) are usable, but the depth should be noted.
- Is the type of soil described in the data? If not, you should assume soil includes
any unconsolidated natural material or fill above bedrock and excludes human-generated materials such as slabs, pavements, asphalt, concrete, brick, rock, ash,
or gravel.
- Were samples collected upwind and downwind of sources of air pollution—both
on site and off site—and at "hot spots?" Were samples collected appropriately for
identifying "hot spots?"
- Have any soil removal activities (e.g., excavation) occurred that may have
changed contamination levels?
- Are the soil samples grab or composite samples?
Soil Gas
- Where are the soil gas sampling locations in comparison to residential
populations?
- Were soil gas samples collected to characterize potential exposures or to
characterize potential explosion hazards?
- What gases are monitored? Do these include those believed to be found in greatest
quantities or the most toxic?
- At what depth is soil gas monitored? Is the monitoring continuous or periodic?
Air
- Over what duration were samples collected (e.g., 1-hour average, 24-hour average,
or longer)? How frequently were these samples collected?
- Is particulate matter sampled as TSP (total suspended particulates), PM10
(particulate matter smaller than 10 microns), or PM2.5 (particulate matter smaller
than 2.5 microns)?
- Were samples collected at locations upwind and downwind from the source?
- Was the source of concern operating at full capacity when the samples were
collected?
- Are the ambient air sampling devices placed in close proximity to a source that
may bias the results?
- Are stationary monitors located in areas representative of pathway exposures?
- Were the data generated by a one-time air sampling event or a long-term ambient air monitoring program? (See text box below.)
Surface Water
- Do surface water data include results for samples both upstream and downstream
of the primary source of contamination?
- Is there information about the number of surface water samples taken at each
sampling station, as well as the frequency, duration, and dates of sampling?
- How does the timing of surface water sampling compare to the timing of site
releases?
- Were samples filtered?
- Were samples collected at locations where people have access (e.g., beaches)?
Sediment
- Was the depth of the samples specified?
- Were samples collected at regular intervals, only in depositional areas, or
following some other type of scheme?
- Were sediments sampled both upstream and downstream from the site?
- Have any sediment removal activities (e.g., dredging, excavation) occurred that may have changed contamination levels?
Food Chain (Biota)
- Did biota sampling consider the species that people in the area typically eat?
- Did the sampling project consider the species that are most likely to accumulate
contaminants? (Note: Vascular plants are much more likely to uptake
contaminants from soil than nonvascular plants; fish at higher trophic levels are
known to have greater body burdens of persistent contaminants that biomagnify
than fish at lower trophic levels; and so on.)
- What age and size of the selected species were sampled? Do these correspond to
the age and size of biota that people would likely capture and eat?
- For the species sampled, were levels of contamination measured in the body parts
that people typically eat? (Note: In fish sampling studies, site investigators often
measure levels of contamination only in fillets; some individuals consume all
parts of fish. Furthermore, fish samples that are high in lipids will contain higher
levels of certain contaminants such as dioxin and PCBs, and top predators will
contain the highest concentrations of metals such as mercury.)
- Are concentrations reported on a wet weight or dry weight basis? (Note: Wet weight concentrations are more representative of exposure point concentrations for most forms of biota.)
Though the above list of questions outlines numerous considerations for evaluating how representative your site's environmental sampling data are of exposure point concentrations, the list is not comprehensive. Using the above questions as a guideline, you should continually question the extent to which the available environmental sampling data represent the range of likely exposure point concentrations.
|
5.1.4 Conclusions About Data Usability
Assessing data validity and representativeness answers two general questions: (1) What environmental sampling data are suitable for making public health decisions? and (2) What data are not suitable for this purpose? Answering these questions requires you to use professional judgment. In some cases, you might decide to use data that other agencies have left out of their analyses; in other cases, you might reject data that others have used. It is your responsibility not only to decide what data are appropriate for the public health assessment, but to justify these decisions, particularly when rejecting data.
As a general rule, you can be confident in environmental sampling data that: (1) are measured by stationary laboratory techniques or rigorously tested field methods (e.g., EPA reference methods for ozone); (2) were collected and analyzed following EPA-approved sampling and analytical methods; (3) are accompanied by thorough QA/QC documentation suggesting the data have been validated or that data quality objectives are met; and (4) adequately characterize potential exposure points. In many cases, environmental sampling data do not meet all four of these criteria. For instance, "TCLP data" (see text box below) are actually not measurements of exposure point concentrations. Such data still can be used in public health assessments, but you will need to identify the data uses and limitations. You also should acknowledge, to the extent possible, how conclusions about potential public health hazards may change if additional information were gathered.
|
Public health assessments must acknowledge when environmental sampling data are of limited or unknown quality (e.g., data sets are incomplete, no QA/QC procedures are documented, or QA/QC procedures are inadequate). You should also note when sampling data—even if found to be perfectly valid—are not representative of exposure point concentrations (e.g., soil samples were collected at depth, groundwater samples were filtered prior to analysis, whole body fish samples were collected instead of fillet samples). If possible, you should indicate whether using such data may lead to overestimates or underestimates of exposure point concentrations. You also should consider how well potential exposures and community concerns will be addressed by drawing public health conclusions based on the limited data or by indicating that no conclusions can be drawn until additional sampling has been performed. Section 5.4 discusses this issue further.
The previous guidance outlines considerations for judging where environmental sampling data are valid and usable for the public health assessment process. Ultimately, health assessors do a lot more than judge the validity and utility of such data. As noted previously, environmental data are often used as indicators of exposure point concentrations. Chapter 7 provides specific guidance on how this is done (e.g., using maximum or average concentrations, selecting appropriate comparison values, and generally putting the data into a public health context).
5.2 Evaluating Modeled Data
Environmental sampling data are critical inputs to the public health assessment process, so much so that ATSDR strongly recommends the use of validated sampling data as the basis for public health decisions. Unfortunately, even validated data are often insufficient—whether spatially or temporally—to characterize all site-specific exposure scenarios. In such cases, models or statistical tools may be used to estimate the nature and extent of contamination, typically for areas or time frames for which relevant sampling data are not available. For example, if current sampling data are available, but past exposures are a critical concern, it might be possible to extrapolate past contaminant concentrations in a particular area with a modeled estimate. Alternatively, if past sampling data are available (e.g., for contaminant concentrations from stack emissions in air before the stack was demolished), it might be useful to model the aerial concentrations so that appropriate sampling locations can be identified. In short, it may be necessary to base public health conclusions on modeling data when environmental sampling data are not available or are very limited. If you do use modeling results as the only basis for your conclusions, you may also consider recommending that sampling take place, where possible (see Section 5.4). Obviously, recommendations for environmental sampling generally are most appropriate for characterizing present and future exposures, and not past exposures.
An extremely broad range of models and statistical tools are available to estimate levels of environmental contamination. These include statistical tools that predict the spatial distribution of contamination by interpolating among observed values; mathematical models that hindcast and forecast the fate and transport of environmental contaminants in various media (e.g., air, groundwater, surface water, and soil) from selected input parameters; and graphical tools that help illustrate contamination trends based on statistical analyses of data. Some of the questions that models can help answer include:
- How far will groundwater contamination extend 10 years from now, based on
current conditions?
- What were the ambient air concentrations of metals 20 years ago, before this
facility installed air pollution controls?
- How will sediment contaminants redistribute after this dam is removed?
- When will the fish be safe to eat?
- How large of an area was affected by a spill or release?
- Where should additional sampling be conducted to assess fate and transport?
The models available to answer these questions range in complexity, from simple screening applications to refined predictive programs. The simple screening models often embody conservative assumptions such that the outputs are upper-bound estimates of the levels of contamination that would be measured in the environment. The refined models, on the other hand, tend to be more rigorous and provide more detailed representations of physical, chemical, and biologic processes. Ideally, the model you are reviewing or using has been calibrated using site-specific data and its performance has been documented in the scientific literature.
When reviewing modeling studies, you ultimately need to determine how accurately model predictions might represent actual conditions. This determination is essentially an evaluation of model uncertainty, which is extremely difficult to quantify. It is important to note that such uncertainties exist with every model, even those that are touted as being the most realistic representations of environmental media. Though health assessors often defer to experts within or affiliated with ATSDR to conduct detailed model evaluations, you should consider certain basic issues to identify model limitations and uncertainties:
- How thorough is the documentation of the modeling? Can another modeler
generate the same outputs from the documentation provided?
- Is the model designed to generate extremely conservative, upper-bound
predictions? Or predictions of the actual output values? What is the likelihood
that the model underestimates or overestimates results?
- What are the limitations and assumptions of the model? Is it being applied to a
scenario for which it was designed?
- Has model performance been documented? Have model predictions been
compared to observed values for your site, or for similar sites?
- Has the model been calibrated or have model performance evaluation studies been
performed?
- What input parameters were used? How were they determined? Are they realistic?
Are the model outputs extremely sensitive to the values of particular inputs?
- How consistent are modeled data and sampling results?
- How broad are the uncertainty bounds on critical model outputs?
- Are you confident that the model outputs are meaningful? Have you reviewed an appropriate use of a model? Or do you think the application is an "abuse" of the model?
— Remember, a model is a simplification of what might happen in the environment, based on our knowledge of underlying fate and transport mechanisms. All models have assumptions and uncertainties and may not represent actual environmental conditions.
If you decide that modeling data are appropriate to include in a public health assessment (i.e., when reliable measured data are not available and the modeling study is found to be acceptable), you must prominently distinguish the data based on models from those based on environmental sampling. The public health assessment should describe the model used, especially its uncertainties, limitations, and assumptions. You should consider recommending additional environmental sampling in cases where important public health decisions are based strictly on modeling data. This decision also may be affected by the nature and extent of community concerns—some community members may not be satisfied knowing that decisions about their health hinge on the results of a modeling analysis.
It should be noted that many journals and books have been published addressing technical aspects of modeling fate and transport of environmental contaminants in specific media. As a result, ATSDR does not expect its health assessors to be capable of critically reviewing all types of modeling studies. If you would like to become more familiar with specific modeling applications, the text box on the following page provides several links to references with much more detailed information on the types of models that health assessors often come across. However, remember that modeling studies can be very difficult to review. If you do not have the expertise to critically review a modeling application, you should seek input from colleagues who are experienced with the model.
References for Further Information on Fate and Transport Models In February 2000, EPA established a Council on Regulatory Environmental Modeling (CREM). According to the CREM Web site (http://www.epa.gov/crem/), Air models: EPA's Support Center for Regulatory Air Models. This Web site includes links to EPA's latest version of the Guideline on Air Quality Models; to user guides to many different types of models (e.g., screening and refined, simple terrain and complex terrain, and mobile sources and stationary sources); and to meteorological data sets for locations across the country. The Web site can be accessed at: http://www.epa.gov/ttn/scram. Subsurface models (soil and groundwater): EPA's Center for Subsurface Modeling Support (CSMoS) is an excellent reference for information on fate and transport models that apply to vadose zone soils and to groundwater. According to the CSMoS Web site, ". . . the primary aims of CSMoS are to provide direct technical support to EPA and State decision makers in subsurface model applications and to manage and support the ground-water models . . ." The
CSMoS Web site can be accessed at: http://www.epa.gov/ada/csmos.html. Surface water and bioaccumulation models: EPA does not have a clearinghouse developed
specifically for surface water and bioaccumulation models. However, the Agency's Center for
Environmental Assessment Modeling (CEAM) specializes in this field. According to CEAM's
mission statement, the center ". . . distributes environmental simulation models and data bases
for urban and rural nonpoint sources, conventional and toxic pollution of streams, lakes and
estuaries, tidal hydrodynamics, geochemical equilibrium, and aquatic food chain
bioaccumulation." The CEAM Web site can be accessed at: http://www.epa.gov/ceampubl/. Multimedia models: The Analytical Contaminant Transport Analysis System (ACTS) is a
software application that environmental scientists can use to evaluate fate and transport in
various media, including air, surface water, and groundwater. ACTS uses both deterministic
and stochastic techniques. More information on ACTS, which was developed under ATSDR's
direction, can be found at: http://www.ce.gatech.edu/research/MESL/software/acts/acts.htm. NOTE: This list should not be viewed as an exhaustive account of the available fate and transport models. EPA, consulting companies, researchers, and many other scientists have developed models for environmental applications. Conducting detailed Web searches and literature reviews can help identify these models. |
5.3 Considering Background Concentrations
Just because a sampling study indicates that environmental contamination exists, that generally does not tell you where the contaminants came from. Ultimately, you will need to evaluate the public health implications of exposure to measured or predicted levels of contamination, regardless of whether chemicals are naturally occurring or result from anthropogenic activities. Yet understanding the contributions from "background" concentrations is an important element of your site-specific analysis. In some cases, contaminants cannot be attributed exclusively to a particular site (e.g., "part of the arsenic in residential soil downwind from the smelter is naturally occurring"); in others, contaminants can be attributed primarily to a given source (e.g., "PCBs are not naturally occurring compounds, and the levels observed in the fish are believed to originate predominately from the capacitor manufacturing plant's discharges"), or multiple sources (e.g., "concentrations of PCE in drinking water downgradient from the commercial/industrial zone may be related to merging plumes from multiple dry cleaning facilities in the area"). It is important for public health assessments to include this perspective.
"Background" is a widely used term, but it does not have a single definition. In fact, two definitions of background are commonly used:
- Naturally occurring ambient levels of substances in the environment that have not
been influenced by humans (e.g., metals that are found in soils).
- Anthropogenic levels of substances in the environment due to human-generated, non site-related sources (e.g., lead in soil along a roadway, benzene in ambient air as a result of a city's motor vehicle traffic, radiation in sediments that resulted from fallout from past use and testing of nuclear weapons).
When reading or hearing references to "background" contamination, you should be sure to understand exactly what that means in the context of your site. There are general rules for how to interpret environmental sampling data in light of background concentrations.
- When levels of contamination are higher than background, you can generally
conclude that some source—either the site you are evaluating or some other
source—has contaminated the media of concern. (Providing you with perspective
on your sampling data, not on pinpointing a particular source.)
- When valid and representative sampling data are consistent with background
concentrations, you typically conclude that local sources have not significantly
impacted the media of concern.
- Finally, when sampling data indicate that levels of contamination are lower than background, there might be a problem. By definition, "background" is supposed to be the naturally occurring or ambient levels of substances in the environment or the levels of contamination that result from anthropogenic sources. If environmental samples consistently show concentrations lower than background, then it is possible that the samples are biased low or that the background levels you have selected are biased high.
This last scenario emphasizes the need for identifying reliable, representative background data. In general, site-specific background data are preferred for use in public health assessments. If not available, background data for the region, state, or nation may be applied. When identifying appropriate background data, you should select high-quality data that are most representative of the site. For instance, when identifying background data for metals in soils, you should use soils that have similar physical and geological characteristics as site soils, such as sandy or loamy. Some sources of background data include site investigation reports, data from nearby sites, state and local environmental agencies, or other state and local organizations. Refer to the text box below for tips on where to access background data for certain media.
|
5.4 Identifying and Filling Critical Data Gaps
After reviewing environmental and modeled data, you still may be missing some information that will help you understand to what substances and at what concentrations people could be exposed. What you will need to decide is whether the missing information is critical and therefore should be highlighted as a data gap or whether the missing information is not essential for reaching public health conclusions. This distinction is important and is best gained through experience, but some examples might help illustrate the difference:
- Critical data gaps. In some cases, the available site documentation truly is
insufficient for drawing public health conclusions on certain issues. Perhaps
surface soil at a site of an unplanned release where the public has access was
never sampled, or a drinking water well downgradient from a leaking underground
storage tank was never sampled, or the well was sampled but not for the substance
you have identified as a concern. These cases are examples of data gaps that must
be filled if you are to reach a defensible conclusion. In cases where sampling data
are available, you still might decide that the spatial and temporal extent of the
sampling—or the quality of the sampling—do not form an adequate basis for
drawing public health conclusions. You can address these critical data gaps by
recommending future sampling efforts; you may also recommend additional
sampling to confirm results from modeling studies that predict current and future
levels of contamination. If the data gap pertains to past exposure, which obviously
cannot be characterized by sampling, modeling studies or exposure investigations
may be warranted.
- Data gaps that do not necessarily need to be filled. In other cases, however, you
might recognize that your site has gaps in sampling data, but these gaps do not
necessarily preclude you from reaching a defensible public health conclusion. An
example of this is for sites with eliminated exposure pathways. If a site has an
unplanned release to soil, but no one has access to the area where the spill took
place, then sampling of the contaminated soils is unnecessary to answer public
health questions. As another example, you might be able to make judgments about
levels of contamination in one medium based on other information you have
available for your site. For instance, a site with metal-contaminated sediments
might have fish tissue sampling data for species at higher trophic levels (i.e., at
the top of the "food chain"), but not for species at lower trophic levels. Knowing
that mercury biomagnifies in the food chain, you can evaluate exposures assuming
that mercury concentration in the fish at lower trophic levels likely does not
exceed that at higher trophic levels. Such an approach not only is scientifically
defensible as a first approximation in most ecosystems, but would help ensure that
the available resources are not spent collecting information that probably will not
change your public health conclusions.
(Note: Any approach to assuming contaminant concentrations obviously varies among sites and with the contaminant(s) in question. For example, for organic compounds like PCBs or dioxins, species-specific lipid content typically influences the concentrations in fish more than trophic level hierarchies. It is always critically important to consider the specific characteristics of your contaminants of interest.)
Typically, when you conclude that data gaps need to be filled, ATSDR will recommend that other agencies or organizations, such as EPA, tribal groups, state agencies, or site owners, conduct sampling. In a few cases, ATSDR will conduct additional sampling itself. (State-of-the-art modeling tools may also be appropriate in cases where ATSDR has sufficient reason to believe these tools will help define past exposures or help determine where sampling should be conducted) . Regardless of who conducts the sampling, you should be familiar with the components of designing and implementing environmental sampling programs, because health assessors often are asked to review sampling plans or help develop them.
Understanding the goals of the sampling program is essential to designing and implementing a sampling program that will meet public health assessment needs. Asking why sampling is being conducted is critical. For instance, at a site with soil contamination and pending remediation projects, do you want to gather samples to confirm that reported soil excavation was completed? Or do you need information about the substance concentrations at exposure points? If the former, a quick and efficient field screening sampling program may be all that is necessary to meet your goals. If the latter, a detailed field sampling program meeting the more stringent CLP methods and QA/QC requirements may be necessary. Other considerations for establishing goals of sampling programs include:
- What public health value will be added by completing the sampling program?
- How will sampling characterize the spatial extent of contamination?
- How will sampling characterize the temporal extent of contamination?
- Will follow-up sampling be necessary?
After establishing the sampling goals, sampling and analysis plans are developed to ensure that the sampling effort meets these goals. As part of preparing a plan, background information about the site is collected to understand site conditions that can impact the implementation of a sampling program. Conditions to consider include presence of other sources of contaminants, access restrictions, physical hazards, and location of existing sampling stations. These factors will influence where samples can be collected and the logistical considerations that need to be addressed as part of program implementation. The sampling and analysis plan should act as a guide for the agency or organization conducting the sampling program. Components of a plan include:
- Environmental media to be sampled.
- Analytes to be measured within these media.
- Sampling and analytical methods.
- Proposed sampling locations.
- Sampling schedule (frequency and duration).
- Data quality objectives, which consider precision, accuracy, completeness, and
representativeness.
- QA/QC measures (e.g., use of duplicate samples and replicate analyses to
characterize measurement precision; use of audit samples to assess measurement
accuracy; analysis of field blanks to determine whether sampling equipment are
contaminated; specification of sample handling procedures, such as holding times
and chain-of-custody requirements; types of equipment calibration).
- Health and safety considerations for field personnel.
Other agencies, particularly EPA, have published far more extensive guidance on this topic. Some references for conducting sampling are included at the end of this chapter, but environmental agencies are an excellent source for this type of information.
5.5 Summarizing and Presenting Environmental Data in the Public Health Assessment Document
After evaluating a site's environmental sampling data, you will begin to evaluate the public health significance of the measured or estimated levels of contamination (see Chapters 6, 7, and 8). As you proceed with these evaluations, you eventually will need to summarize and document the data in the public health assessment document. Though seemingly straightforward, this task is often quite challenging, especially for sites with large volumes of sampling data available. Because the amount and types of sampling data vary greatly from one site to the next, there is no single protocol to follow for how to summarize and present data. This section does, however, provide several guidelines that can be followed when summarizing and presenting data.
Above all else, summaries of environmental sampling data should focus on the most important aspects of the site or issue being evaluated (see text box below). For example, a site might have years of quarterly monitoring data of contaminated groundwater. If no residents have ever been exposed to this groundwater, however, the public health assessment probably does not need pages of summary statistics of the sampling data. Detailed summaries are most appropriate for potential and completed exposure pathways (see Chapter 6) and exposure point concentrations (see Chapter 7).
|
The text of the PHA or PHC (usually the Discussion section) should provide a brief narrative summarizing the available environmental sampling data. The text may include a discussion of trends in the data. The discussion of trends can include descriptions of spatial distribution, "hot spots," concentration changes in time, and substance differences between media. The text should also describe the limitations, quality, and usefulness of the data. Ultimately, you will have to use your judgment in deciding how to present and summarize data. Following are some questions that health assessors typically ask regarding data presentation, along with some guidance on typical presentation approaches:
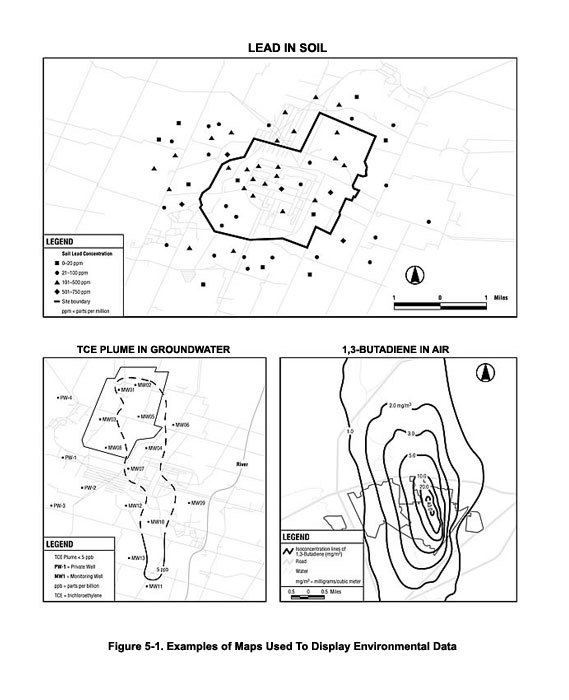
- What format should be used to display the information? You have many different options when deciding how to present site data. The data and information can be described in text, tables, charts, maps, and other formats. The most appropriate selection depends on the data that are available and the concepts you are communicating. For instance, to illustrate the spatial extent of a contaminant plume, maps are especially helpful (see Figure 5-1); to show how the number of days with potentially unhealthy ozone concentration has changed each year during the past 25 years, a chart is a useful tool (see Figure 5-2); and to list sampling summary statistics for many different substances that have been measured at a surface water monitoring station, a table is an appropriate display (see Table 5-1). Regardless of the display used, the text should also describe the contents of the summary.
- How extensive do data summaries need to be? Once again, the answer to this question depends on the type and amount of data available for a site. For example, at a site where the only sampling data available are roughly a dozen tap water "grab" samples collected by a concerned resident, it makes sense simply to list the result of every single sample. At a larger site with multi-media contamination, however, presenting every sampling result would likely cause the public health assessment to be incredibly long. In these cases, it makes sense to condense large volumes of sampling data into summary tables (see the next bulleted item for more details on this). For other applications, it might be possible to summarize an extremely large volume of sampling data in just one sentence. For example, "the state has sampled the air for sulfur dioxide for 20 years but has never found a concentration higher than EPA's health-based air quality standards."
- What pieces of information need to go into data summaries? You may find
presenting substance concentrations in the text useful when only a few substances
are discussed, but overwhelming when many substances are discussed. Regardless
of how much information you present in the text, you should include summary
tables that provide more detailed information about the substances found at the
site. Where possible, summary tables should list:
- Contaminants detected.
- Range of concentrations
- Location and date of the maximum concentration
- Central tendency value (e.g., mean concentration or 95 percent upper confidence limit for the mean
- Frequency of detection (overall)
- Appropriate health-based comparison values or screening values (see Chapter
7)
- Frequency of detection (above comparison values)
- Uncertainty (measures of error)
Further, all displays developed should be standalone. As shown in the examples, always include the source of the displayed data, acronym definitions, and specific notations that might be needed to support interpretation of the display.
When deciding how extensive data summaries should be, you should ultimately consider the information needs of the audience. For instance, at sites with widespread contamination, residents often want to know how levels of contamination vary across neighborhoods, or even from one house to the next. Your data presentations should be sensitive to these needs, to the extent possible.
For a better feel for how sampling data are reported in public health assessments in practice, you may wish to consult with your experienced colleagues and browse through a selection of ATSDR's public health assessments, many of which are available on the agency's Web site (http://www.atsdr.cdc.gov/HAC/PHA/). You should remember, however, that every site presents unique data summary challenges, and a data summary format used for a given site might not be appropriate for your site.
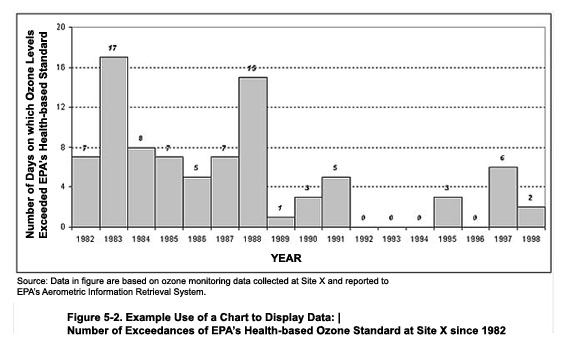
>Source: Data in figure are based on ozone monitoring data collected at Site X and reported to EPA's Aerometric Information Retrieval System.
Table 5-1. Example Use of a Table to Display Data:
Surface Water Sampling Data for Selected Metals Along the XXX River
| Contaminant | Number of Samples | Number of Detections | Range of Concentrations Measured at Levels Greater Than the CV (ppb) | Health-Based Comparison
Value (CV)
(ppb) |
Type of CV | Number of Detections Greater Than CV |
| Aluminum | 100 | 99 | 21,200–123,000 | 20,000 | EMEG-ci | 6 |
| Barium | 100 | 99 | 839–3,280 | 700 | RMEG-c | 7 |
| Beryllium | 106 | 28 | 9.1 | 4 | MCL | 1 |
| Chromium | 102 | 83 | 34.7–151 | 30 | RMEG-c | 4 |
| Copper | 100 | 99 | 2,810 | 1,300 | MCLG | 1 |
| Manganese | 99 | 99 | 576–84,900 | 500 | RMEG-c | 98 |
| Mercury | 100 | 97 | 2.2–43.9 | 2 | MCL | 53 |
| Nickel | 102 | 65 | 219 | 100 | LTHA | 1 |
| Silver | 105 | 80 | 50.2–308 | 50 | RMEG-c | 6 |
| Thallium | 103 | 17 | 0.51–54 | 0.5 | LTHA | 9 |
| Vanadium | 103 | 58 | 31.4–172 | 30 | EMEG-ci | 10 |
Concentrations listed are total metals in surface water; detailed data for antimony, arsenic, cadmium, lead, and zinc are shown in a separate table.
All samples were collected after field personnel vigorously disturbed sediments at the sampling locations.
For contaminants with multiple health-based comparison values, the lowest comparison value was selected for this presentation.
Abbreviations used (see Chapter 7 for definitions of these values):
LTHA Lifetime Health Advisory for drinking water (EPA)
MCL Maximum Contaminant Level for drinking water (EPA)
MCLG Maximum Contaminant Level Goal for drinking water (EPA)
ppb parts per billion
RMEG-c Reference Dose Media Evaluation Guide for children's exposure (ATSDR)
ATSDR. 1994. Environmental data needed for public health assessments: a guidance manual. Atlanta: US Department of Health and Human Services. March 1994.
EPA. 1989. Risk assessment guidance for superfund. Volume 1. Human health evaluation manual. US Government Printing Office. Publication No.: EPA/540/1-89/002.
EPA. 1992a. Guidance for data useability in risk assessment (part A). Publication No.: 9285.7-09A. PB92-963356. http://www.epa.gov/superfund/programs/risk/datause/parta.htm.![]()
Shacklette H, Boerngen J. 1984. Element concentrations in soils and other surficial materials of
the conterminous United States. Washington: US Government Printing Office. US Geological
Survey Professional Paper 1270. http://pubs.er.usgs.gov/pubs/pp/pp1270![]()
Note: The first two of these resources are written specifically for remedial investigations at Superfund sites, but the information they contain is broadly applicable.
EPA. 1992b. Guidance for data useability in risk assessment (part B). Publication No.: 9285.7-09A. PB92-963356. http://www.epa.gov/superfund/programs/risk/datause/partb.htm.![]()
EPA. 1998. Test methods for evaluating solid waste, physical/chemical methods, revision 5. http://www.epa.gov/epaoswer/hazwaste/test/main.htm.![]() April 1998.
April 1998.
EPA. 1999a. Data validation standard operating procedures for Contract Laboratory Program
routine analytical services. Version 2.1. U.S. EPA Region 4 Science and Ecosystem Support
Division. Office of Quality Assurance. http://www.epa.gov/region4/sesd/oqa/rassop.html.![]()
EPA. 1999b. Compendium of methods for the determination of toxic organic compounds in
ambient air—second edition. Publication No.: EPA/625/R-96/010b. http://www.epa.gov/ttn/amtic/airtox.html. ![]()
EPA. 1999c. Compendium of methods for the determination of inorganic compounds in ambient
air. Publication No.: EPA/625/R-96/010a. http://www.epa.gov/ttn/amtic/inorg.html.![]()
EPA. 2004. List of designated reference and equivalent methods (For measuring ambient air
concentrations of criteria pollutants). http://epa.gov/ttn/amtic/files/ambient/criteria/ref804.pdf.![]()
EPA. 2000a. Data quality objectives process for hazardous waste site investigations. Publication
No.: EPA/600/R-00/007. http://www.epa.gov/quality/qs-docs/g4hw-final.pdf.![]()
EPA. 2000b. Guidance for assessing chemical contaminant data for use in fish advisories volume 1: fish sampling and analysis. Third Edition. http://www.epa.gov/waterscience/fishadvice/volume1/.![]()
1 In limited cases, biological monitoring data may be available to serve as an additional source of information related to possible site-related exposures (see Chapter 6, Section 6.7). In all cases, however, environmental sampling data are critical to the public health assessment and the evaluation of possible exposures.
Agency for Toxic Substances and Disease Registry, 1825 Century Blvd, Atlanta, GA 30345
Contact CDC: 800-232-4636 / TTY: 888-232-6348