Where are U.S. ART clinics located, how many ART cycles
did they perform in 2005, and how many infants were born?
Although ART clinics are located throughout the United States, generally in
or near major cities, the greatest number of clinics is in the eastern
United States. Figure 1 shows the locations of the 422
reporting clinics. The fertility clinic section of this report, arranged in
alphabetical order by state, city, and clinic name, provides specific
information on each of these clinics. The number of clinics, cycles
performed, live-birth deliveries, and infants born as a result of ART all
have increased steadily since CDC began collecting this information in 1995
(see Section 5). Because in some cases more than
one infant is born during a live-birth delivery (e.g., twins), the total
number of infants born is greater than the number of live-birth deliveries.
CDC estimates that ART accounts for slightly more than 1% of total U.S.
births.
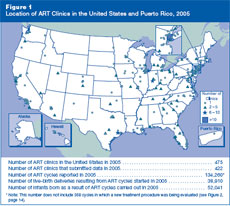
Figure 1: Location of ART Clinics
in the United States and Puerto Rico, 2005.
|
What types of ART cycles were used in the United States
in 2005?
For 72% of ART cycles carried out in 2005, fresh nondonor
eggs or embryos were used. ART cycles that used frozen nondonor embryos
were the next most common type, accounting for approximately 15% of the
total. In about 12% of cycles, eggs or embryos were donated by another
woman. A very small number of cycles (less than 1% of the ART cycles
carried out in 2005) involved the evaluation of a new treatment
procedure. The vast majority of these cycles included pre-implantation
genetic diagnosis for screening of genetic disorders, and a few involved
the retrieval of immature oocytes. Because of small number, cycles in
which a new treatment procedure was being evaluated are not included in
the total number of cycles reported in
Sections 2 through 5 of the national
report and in the individual fertility clinic tables. Thus, data
presented in subsequent figures in this report and in the individual
fertility clinic tables are based on 134,260 ART cycles.
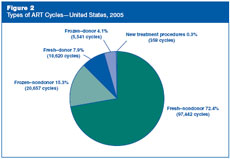
Figure 2: Types
of ART Cycles—United States, 2005.
How old were the women who used
ART in the United States in 2005?
The average age of women using ART services in 2005
was 36. The largest group of women using ART services were women
younger than 35, representing 40% of all ART cycles carried out in
2005. Twenty-two percent of ART cycles were carried out among women
aged 35–37, 19% among women aged 38–40, 10% among women aged 41–42,
and 9% among women
older than 42.
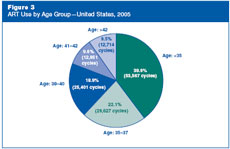
Figure 3: ART
Use by Age Group—United States, 2005.
How did the types of ART cycles
used in the United States in 2005 differ among women of different
ages?
Figure 4
shows that, in 2005, the type of ART cycles varied by the woman’s
age. The vast majority (96%) of women younger than 35 used their own
eggs, whereas only 3% used donor eggs. In contrast, 22% of women
aged 41 to 42 and more than half (55%) of women older than 42 used
donor eggs. Across all age groups, more ART cycles using fresh eggs
or embryos were performed than cycles using frozen embryos.
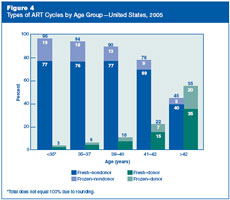
Figure 4:
Types of ART Cycles by Age Group—United States, 2005. |