Tobacco Use by Geographic Region
Tobacco use, including cigarettes, smokeless tobacco, and cigars, varies by geographic region within the United States. People living in certain regions and communities often suffer more from poor health because of tobacco use, especially cigarette smoking.1
By U.S. Census region, prevalence of cigarette smoking among U.S. adults is highest among people living in the Midwest (22.2%) and the South (22.7%), and lowest among those living in the Northeast (20.1%) and West (16.3%) regions.2 People in the Midwest and South also tend to use multiple types of tobacco products, such as cigarettes and smokeless tobacco.1
By county population types, prevalence of cigarette smoking among U.S. adults is highest among those living in rural areas (28.5%) and urban areas (25.1%), and lowest among those living in small metropolitan areas (22.0%) and large metropolitan areas (18.3%).2
The health of people living in rural areas is impacted by tobacco use more so than those in urban and metropolitan areas, often because of socioeconomic factors, culture, policies, and lack of proper healthcare.3 For more information about rural related health disparities visit: Advancing Tobacco Prevention and Control in Rural America pdf icon[PDF–3.76 MB]external icon.
In general, rates of death attributable to smoking are lower in states with lower prevalence of smoking.1

The following charts show current tobacco use among U.S. adults aged 18 years and older by four major geographic regions—Midwest, South, Northeast, and West and by county population type—large metropolitan, smaller metropolitan, urban, and rural. Information within these charts was collected in the 2016 National Survey on Drug Use and Health and includes persons reporting cigarette, smokeless tobacco, and cigar use within the 30 days before the survey was taken.2
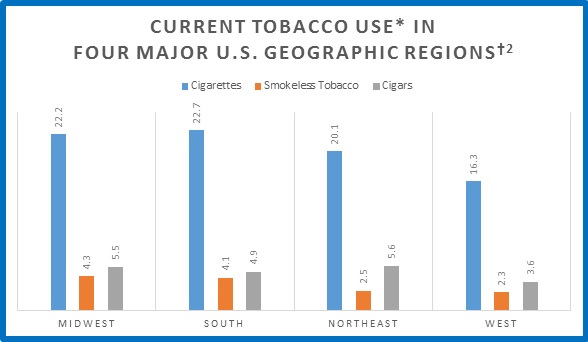

* Data taken from the National Survey on Drug Use and Health, 2016, and refer to persons aged 18 years and older reporting cigarette, smokeless tobacco, and cigar use in the past 30 days.
† Regions are designated by the U.S. Census Bureau: Northeast (Connecticut, Maine, Massachusetts, New Hampshire, New Jersey, New York, Pennsylvania, Rhode Island, and Vermont); Midwest (Indiana, Illinois, Iowa, Kansas, Michigan, Minnesota, Missouri, Nebraska, North Dakota, Ohio, South Dakota, and Wisconsin); South (Alabama, Arkansas, Delaware, District of Columbia, Florida, Georgia, Kentucky, Louisiana, Maryland, Mississippi, North Carolina, Oklahoma, South Carolina, Tennessee, Texas, Virginia, and West Virginia); West (Alaska, Arizona, California, Colorado, Hawaii, Idaho, New Mexico, Montana, Oregon, Nevada, Utah, Washington, and Wyoming).
§ Large metropolitan—counties of 1 million or more population; Small metropolitan—counties with less than 250,000 population; Urban—non-metropolitan counties with 20,000 or more population in urbanized areas; Rural—non-metropolitan counties with fewer than 2,500 population in urbanized areas.
- The proportion of current cigarette smokers who report smoking daily is highest among smokers living in the Midwest (68.3%), and lowest among those in the West (56.9%).1
- The proportion of current cigarette smokers who report intermittent (nondaily) smoking is highest among cigarette smokers living in the West (43.1%) and lowest among those living in the Midwest (31.7%).1
- Smokers living in rural areas are more likely to smoke 15 or more cigarettes per day than smokers living in urban areas.1
- Adolescents in rural regions begin smoking cigarettes earlier in life, and daily smoking is more likely among adolescents in rural areas than adolescents in suburban and urban areas.3
Smokers are more likely than nonsmokers to develop heart disease, stroke, lung cancer, and other lung diseases.1
- The highest rates of death attributable to smoking occur in the southern states of Kentucky and West Virginia.1
- People living in rural areas have 18–20% higher rates of lung cancer than people living in urban areas.4
- Lung cancer incidence is highest in the South (76.0%) and lowest in the West (58.8%).5
- Coronary heart disease and stroke rates are higher in the South than in other regions.6,7
- Chronic obstructive pulmonary disease (COPD) hospitalization risk is higher among people living in regions of Appalachia, the southern Great Lakes, the Mississippi Delta, the Deep South, and West Texas.8
- American Indians or Alaska Natives (AI/ANs) living in the Northern Plains region and in Alaska have the highest smoking prevalence among AI/ANs, and also the highest rates of lung cancer and heart disease.9
- Local smokefree laws vary significantly by geographic region and by the different communities within them.
- In some states, communities having residents with less education and lower incomes are less likely to be covered by comprehensive smoke-free laws that prohibit smoking in all areas of workplaces, restaurants, and bars.10
- In some states, urban areas and areas with high per-capita income are more likely to have strong smokefree laws.10
- Residents of rural areas are more likely to allow smoking in the presence of children in their homes and cars.3
- The percentage of children in small rural areas who live in a household with a smoker (35.0%) is greater than the percentage of children in urban areas who live with a smoker (24.4%).3
In some states without statewide comprehensive smoke-free laws, substantial progress has been made in adopting comprehensive smoke-free laws at the local level.11
- The tobacco industry has historically targeted young rural men by presenting advertisements with rugged images as cowboys, hunters, and race car drivers.3,13
- Youth in rural areas are less likely to be exposed to anti-tobacco messages in the media.3,13
- Low income and predominantly minority neighborhoods often have more tobacco retailers and more tobacco advertising than other neighborhoods.14,15
- People who see tobacco promotions in places where tobacco is sold are more likely to smoke.16
- African American communities have a high number of exterior and interior point-of-sale advertising for tobacco products.17
Strategies that restrict advertising, limit the number of retailers in neighborhoods, and prohibit price discounting can help reduce tobacco use and its negative health outcomes.14
Efforts to promote implementation of statewide and local comprehensive smoke-free laws are critical to protect nonsmokers from preventable health hazards in the places they live, work, and gather.11
Culturally appropriate anti-smoking health marketing strategies and mass media campaigns like CDC’s Tips From Former Smokers national tobacco education campaign, as well as CDC-recommended tobacco prevention and control programs and policies, can help reduce geographic disparities in tobacco use and exposure.
- U.S. Department of Health and Human Services. The Health Consequences of Smoking—50 Years of Progress: A Report of the Surgeon General. Atlanta: U.S. Department of Health and Human Services, Centers for Disease Control and Prevention, National Center for Chronic Disease Prevention and Health Promotion, Office on Smoking and Health, 2014 [accessed 2018 Jun 18].
- Substance Abuse and Mental Health Services Administration. Results from the 2016 National Survey on Drug Use and Health: Detailed Tables pdf icon[PDF–9.48 MB]external icon. Rockville, MD: Substance Abuse and Mental health Services Administration, Center for Behavioral Health Statistics and Quality, 2017 [accessed 2018 Jun 18].
- American Lung Association. Cutting Tobacco’s Rural Roots: Tobacco Use in Rural Communitiesexternal icon. Chicago: American Lung Association, 2015 [accessed 2018 Jun 18].
- Singh GK, Williams SD, Siahpush M, Mulhollen A. Socioeconomic, Rural-Urban, and Racial Inequalities In US Cancer Mortality: Part I—All Cancers and Lung Cancer and Part II—Colorectal, Prostate, Breast, and Cervical Cancersexternal icon. Journal of Cancer Epidemiology 2011; doi.org/10.1155/2011/107497 [accessed 2018 Jun 18].
- Centers for Disease Control and Prevention. Racial/Ethnic Disparities and Geographic Differences in Lung Cancer Incidence—38 States and the District of Columbia, 1998-2006. Morbidity and Mortality Weekly Report 2010;59(44):1434-8 [accessed 2018 Jun 18].
- Centers for Disease Control and Prevention. Coronary Heart Disease and Stroke Deaths—United States, 2006. Morbidity and Mortality Weekly Report, 2011;60(Suppl):62-6 [accessed 2018 Jun 18].
- Mozaffarian D, Benjamin EJ, Go AS, Arnett DK, Blaha MJ, Cushman M, et al. Heart Disease and Stroke Statistics—2015 Update: A Report from the American Heart Associationexternal icon. Circulation, 2015;131. [accessed 2018 Jun 18].
- Holt JB, Zhang X, Presley-Cantrell L, Croft JB. Geographic Disparities in Chronic Obstructive Pulmonary Disease (COPD) Hospitalization among Medicare Beneficiaries in the United Statesexternal icon. International Journal of COPD, 2011; doi:http://dx.doi.org/10.2147/COPD.S19945 [accessed 2018 Jun 18].
- Plescia M, Henley SJ, Pate A, Underwood JM, Rhodes K. Lung Cancer Deaths Among American Indians and Alaska Natives 1990–2009external icon. American Journal of Public Health, 2014;104(Suppl 3):S388-95 [accessed 2018 Jun 18].
- Huang J, King BA, Babb SD, Xu X, Hallett C, Hopkins M. Sociodemographic Disparities in Local Smoke-Free Law Coverage in 10 Statesexternal icon. American Journal of Public Health, 2015;105(9):1806-13 [accessed 2018 Jun 18].
- Centers for Disease Control and Prevention. State and Local Comprehensive Smoke-Free Laws for Worksites, Restaurants, and Bars—United States, 2015. Morbidity and Mortality Weekly Report, 2016;65(24):623-6 [accessed 2018 Jun 18].
- Babb S, Malarcher A, Schauer G, Asman K, Jamal A. Quitting Smoking Among Adults—United States, 2000-2015. Morbidity and Mortality Weekly Report 2017;65(52):1457-64 [accessed 2018 Jul 17].
- Centers for Disease Control and Prevention. Best Practices User Guide: Health Equity in Tobacco Prevention and Control. Atlanta: U.S. Department of Health and Human Services, Centers for Disease Control and Prevention, National Center for Chronic Disease Prevention and Health Promotion, Office on Smoking and Health, 2015 [accessed 2018 Jun 18].
- Center for Public Health Systems Science. Point-of-Sale Strategies: A Tobacco Control Guide pdf iconpdf icon[PDF–7.81 MB]external iconexternal icon. St. Louis: Center for Public Health Systems Science, George Warren Brown School of Social Work at Washington University in St. Louis and the Tobacco Control Legal Consortium, 2014 [accessed 2018 Jun 18].
- Yu D, Peterson NA, Sheffer MA, Reid RJ, Schneider JE. Tobacco Outlet Density and Demographics: Analysing the Relationships with a Spatial Regression Approach. Public Health, 2010;124(7):412–6 [cited 2018 Jun 18].
- U.S. Department of Health and Human Services. Preventing Tobacco Use Among Youth and Young Adults: A Report of the Surgeon General. Atlanta: U.S. Department of Health and Human Services, Centers for Disease Control and Prevention, National Center for Chronic Disease Prevention and Health Promotion, Office on Smoking and Health, 2012 [accessed 2018 Jun 18].
- Seindenberg AB, Caughey RW, Rees VW, Connolly GN. Storefront cigarette advertising differs by community demographic profileexternal icon. American Journal of Health Promotion, 2010; 24(6): e26-31 [accessed 2018 Jun 18].
