September 8, 2020, 15:29 PDT
Making Sense of ‘Climate Sensitivity'
New Study Narrows the Range of Uncertainty in Future Climate Projections

NASA GISS Surface Temperature Analysis (GISTEMP v4) trend map of observed global surface temperature change for the period from 1979 to 2019. Future global warming depends on Earth's climate sensitivity and our emissions. Credit: NASA's Goddard Institute for Space Studies
Recently, an international research team published a comprehensive review in the journal Reviews of Geophysics on our state of understanding of Earth's "climate sensitivity," a key measure of how much our climate will change as greenhouse gas emissions increase. Essentially, by narrowing the range of estimates, the researchers found that climate sensitivity isn’t so low that it should be ignored, but it’s also not so high that there is no hope for the planet’s recovery.
We asked the two NASA authors on the study — Kate Marvel, jointly of Columbia University in New York and NASA’s Goddard Institute of Space Studies (GISS) in New York; and GISS Director Gavin Schmidt — to discuss their roles in the study and its significance for understanding the impacts of our warming world on climate.
Q. What exactly is climate sensitivity and why is it important to know its true value?
Schmidt: “We know from studies of the past that Earth’s climate can change dramatically. The evidence shows that the amount of greenhouse gases in the atmosphere can vary over time and make a big difference to the climate. Scientists try to quantify that by estimating how much the surface air temperature, averaged over the whole globe, would change if we doubled the amount of one typical but specific greenhouse gas – carbon dioxide. That number, called climate sensitivity, has quite a wide uncertainty range, and that has big implications for how serious human-made climate change will be.”
Q. Your team was able to narrow the range of estimates of Earth's climate sensitivity by more than 43 percent, from the previously accepted range of 1.5 to 4.5 Kelvin first established in 1979 (roughly 3 to 9 degrees Fahrenheit), to a narrower range of 2.6 to 3.9 Kelvin (roughly 4.5 to 7 degrees Fahrenheit). Why is it important for scientists to narrow this range of uncertainty? What does it mean in practical terms to be able to reduce uncertainties in measuring climate sensitivity?
Schmidt: “Scientists would like to reduce that uncertainty so that we can have more confidence in how we need to mitigate and adapt to future changes. For instance, how much sea level might rise, or how heat waves will get worse, or rainfall patterns change, are tied to the climate sensitivity combined with our actions in changing the atmosphere. A higher climate sensitivity would mean we would have to do more to avoid big changes, while a lower value would mean we’d have more time to adapt. It’s useful to note that we expect to reach double carbon dioxide levels later this century, and that while a few degrees might not seem like much, it's a big deal for the planet. The difference between forests beyond the Arctic Circle or glaciers extending down to New York City is only a range of about 8 K (about 14 degrees Fahrenheit) in the global average, while it changes sea level by 150 meters (more than 400 feet)!”
Get a Monthly Digest of NASA's Climate Change News: Subscribe to the Newsletter »
Q. How can better estimates of climate sensitivity impact policy decisions?
Marvel: “The most important thing about climate sensitivity is that it's not zero. Increasing atmospheric carbon dioxide definitely makes it warmer and increases the risk of extreme weather like drought, downpours, and heat waves. But better estimates of climate sensitivity are important for motivating action. Our results show that it would be foolish to rely on nature to save us from climate change — we don't think it's likely that sensitivity is low. But conversely, it's unlikely that climate sensitivity is so high as to make action pointless.”
Schmidt: “I’m not sure that our policy decisions are that finely tuned to the science of climate sensitivity other than knowing that climate really is sensitive to increasing greenhouse gases. Many climate policies are robust to those uncertainties, but many adaptation decisions will depend on knowing how bad things will get.”
Q. Why has it been so difficult over the past 40 years to narrow this range? What made this new estimate possible?
Schmidt: “There are three main reasons why this has been difficult. First, knowledge of past climate change has been difficult to quantify in globally coherent ways. Of course, we have known about the ice ages for a century or more, but getting accurate estimates of the global changes in temperature, greenhouse gases, and ice sheets has taken time and has needed many scientists working on many different aspects of the problem to come together. Second, the climate change signal has taken time to come out of the ‘noise’ of normal variability. In the 1980s and 1990s, people were still arguing about whether the warming over the 20th century was significant, but with another 20 years of record-breaking temperatures, that has been very clearly shown. Third, our understanding of the processes in the climate that affect sensitivity — clouds, water vapor, aerosols, etc. — has improved immensely with the development of satellite remote sensing, and every decade we are producing better and more useful information. But as these lines of evidence have matured, the need to come up with new methods to tie them all together coherently has become acute — and that was the impetus for this roughly 4-year effort.”
Marvel: “Yes, and in modeling, clouds are some of the biggest wildcards. See go.ted.com/katemarvel.”
Q. What types of evidence did the team consider in reaching its conclusions? Where do the lines of evidence agree and disagree most substantially?
Schmidt: “There are three main sources of information: changes since the late 19th century that have been measured in real time, our understanding of physical processes (particularly clouds), and new and more complete information from periods in the paleoclimate record (the geological past) where the planet was significantly cooler or warmer than today. All of the lines of evidence are mostly commensurate, but specific issues mean that the recent record isn’t good at constraining the high-end values because of the imprecise role of aerosols, and paleoclimate change is less able to constrain the low end because of the uncertain nature of that data. Together, however, we can mostly rule those tails out.”
Q. What were a few of the most significant findings for each of the three lines of evidence studied (feedback processes, the historical warming record, and paleoclimate records)?
Marvel: “For a long time, many people thought that sensitivity estimates derived from paleoclimate — the far past — were incompatible with estimates derived from more recent observations. But there's a difference between a past climate state in which the planet has reached an equilibrium — a ‘new normal’ — and our current climate, where things are very much in flux and continuing to change. There is some uncertainty in just how different the future will look from what we're experiencing now — it's possible we're moving into a new world for which we don't have a recent analogue. And when we take that uncertainty into account in a rigorous way, we find that the far past and the near future may not be telling us such different things after all.”
Schmidt: “What was interesting was that by starting off with a view of climate sensitivity that was a little more sophisticated than people had used previously, we found that there was more coherence among the different lines of evidence than others had found, and since the information we are using really is very independent, that allowed us to narrow the uncertainty.”
Q. Your team used a "Bayesian approach" to calculate your estimated range of climate sensitivity. In layman's terms, what is that?
Schmidt: “A Bayesian approach is really just a mathematical representation of how we do science in general. We have an initial hypothesis, we get some evidence that may or may not support it, and then we update our understanding based on that evidence. And then we do it again (and again, and again, etc.). Over time, and as more evidence accumulates, we hopefully hone in on the most correct answer. Using Bayesian methods allowed us to pull together disparate threads of evidence in a coherent way — allowing for different degrees of confidence in each of the lines of evidence. What is great is that in the future, as more evidence is discovered, we can continue the process and update our understanding again.”
Q. What role did global climate models play in the team's findings?
Marvel: “Complex climate models are useful tools (see here for a good overview). But in this paper, we relied largely on observations: satellite and ground-based measurements of recent trends, paleoclimate datasets, and basic physical principles.”
Schmidt: “Climate models help frame the questions we are asking and can be examined to see how climate patterns in space and time connect to things we can directly observe. But we know that climate models have a lot of uncertainty related (for instance) to cloud processes, and so we didn’t use them directly to estimate sensitivity. You could, however, use our results to assess whether a climate model has a sensitivity that is within our independently constrained range.”
Q. Your new estimated range of Earth's climate sensitivity finds the value is around the mid-point of the previous estimate range rather than on the lower or higher end. What does that mean in practical terms for projections of Earth's global temperatures and Earth's climate in this century?
Schmidt: “It means that climate sensitivity is not so low that we can ignore it, nor is it so high that we should despair. Ultimately, it tells us that while human-made climate change is (and will continue to be) a problem, our actions as a society can change that trajectory.”
Q. How likely is it that Earth's climate sensitivity could be higher than 3.9 Kelvin? Lower than 2.6 Kelvin?
Schmidt: “There are subjective elements to the analysis we performed, and other people could decide to weight things a little differently. We explored some of these alternative choices and that broadens the uncertainty a little, but basically, we estimate that there is about a one-in-six chance that it was less than the low end, and one-in-six that it was higher than the high end. That’s not impossible, but, if true, then a lot of our assessments would have to be quite a ways off.”
Q. The concentration of carbon dioxide in Earth's atmosphere is currently around 414 ppm (parts per million). What are the projections for future carbon dioxide increases under the range of current emissions scenarios and how does having a better estimate of climate sensitivity improve our understanding of how our climate may change in the future?
Schmidt: “The future trajectory of carbon dioxide will depend on what we do as a society — if we decide to burn all the fossil fuels we can find, we could reach 900 ppm by the end of the century, but if we aggressively reduce emissions, we could stay below 500 ppm, maybe lower. The climate sensitivity tells us what we can expect in terms of temperature — between another 1 or 2 degrees Celsius (1.8 or 3.6 degrees Fahrenheit) for the low scenario, which would be very serious, to between 4 and 7 degrees Celsius (7.2 and 12.6 degrees Fahrenheit) for the high end scenario, which would be a disaster.”
Q. What about your study did you find most surprising?
Marvel: “How difficult it was to get everyone with all their different expertise working together on a big, joint effort. In the end, I think everyone realized how important it was and how this will be a strong basis for everyone’s future research.”
Schmidt: “How consistent the results were across all three different approaches.”
Q. What was your role in the study?
Marvel: “I was one of the lead scientists on the section looking at historical constraints on sensitivity, making sure that we took into account the differences in how things changed over the 20th century and how things will change going forward, and working to make sure that the uncertainties in historical climate records were properly included.”
Schmidt: “I worked mainly on the paleoclimate section, making sure that we used the most appropriate data from key periods in the planet’s history (like the last ice age or the last time carbon dioxide was as high as it is now — some 3 million years ago).”
July 14, 2020, 08:47 PDT
Sea Level 101, Part Two: All Sea Level is ‘Local'

Global sea level rise impacts all coastlines differently due to numerous factors. The height of the ocean relative to the land along a coastline is referred to as relative sea level. Credit: joiseyshowaa/Flickr CC BY-SA 2.0
As discussed in our last Sea Level 101 blog post, we know sea level on the open ocean isn’t really flat. A number of factors combine to determine the topography of the ocean surface.
Global sea level rise is complex as well. To begin with, it has multiple causes, including the thermal expansion of the ocean as it warms, runoff of meltwater from land-based ice sheets and mountain glaciers, and changes in water that’s stored on land. These factors combine to raise the height of our global ocean about 3.3 millimeters (0.13 inches) every year. That rate is accelerating by another 1 millimeter per year (0.04 inches per year) every decade or so.
Another factor that makes sea level rise complex is that it’s not uniform around the globe. If you look at a global map of sea level rise, you’ll find it’s happening rapidly in some places and more slowly in others. This means that although sea level rise affects coastal areas all over our ocean planet, some regions feel its effects sooner and more severely than others. This is reflected in future projections of sea level rise, with many cities in Asia expected to be among the hardest hit localities. Here in the United States, cities expected to see the worst impacts include New York, Miami and New Orleans, to name but a few.
Indeed, at any given place and time around our planet, sea level rise varies. But why is that? It turns out that when it comes to sea level rise, it’s all local. And it’s all relative.
Relative Sea Level
“Relative sea level” refers to the height of the ocean relative to land along a coastline. Common causes of relative sea level change include:
- Changes due to heating of the ocean, and changes in ocean circulation
- Changes in the volume of water in the ocean due to the melting of land ice in glaciers, ice caps, and ice sheets, as well as changes in the global water cycle
- Vertical land motion (up or down movements of the land itself at a coastline, such as sinking caused by the compaction of sediments, or the rise and fall of land masses driven by the movement of continental or oceanic tectonic plates)
- Normal, short-term, frequent variations in sea level that have always existed, such as those associated with tides, storm surges, and ocean waves (swell and wind waves). These variations can be on the order of meters or more (discussed in more detail in our previous blog post).
Let’s look at these factors more closely.
When you heat up water, it expands and takes up more space. How much it expands depends on how deep the warming occurs as well as the temperature of the water to begin with. For example, in Earth’s tropics, a 1-degree Celsius (1.8 degrees Fahrenheit) warming in the temperature of the top 100 meters (328 feet) of the ocean raises sea level there by about 3 centimeters (1.2 inches). This thermal expansion of the ocean is responsible for between one-third and one-half of the overall global sea level rise observed over the last two decades. Because Earth’s ocean isn’t warming at the same rate everywhere, it results in regional differences in relative sea level rise, with areas that are warming faster seeing faster sea level rise.
Changes in ocean circulation also contribute to regional sea level differences. For example, in the United States, El Niño, a cyclical, naturally-occurring ocean circulation pattern of warming (in the central and eastern tropical Pacific Ocean) and cooling (in the western tropical Pacific Ocean) can temporarily raise relative sea level along the West Coast by more than a foot for up to a couple of years. Similarly, along the U.S. East Coast, the speedup or slowdown of the major ocean current known as the Gulf Stream can temporarily add or subtract as much as 5 centimeters (2 inches) of sea level height to local coastlines.
Next, there’s melting land ice in the Greenland and Antarctic ice sheets and Earth’s glaciers and ice caps. The largest contribution is from Greenland, which loses hundreds of billions of tons of ice a year and is a major contributor to sea level rise across the globe. As Greenland loses ice, the land beneath its ice sheet rises as the weight of the ice sheet is removed. As a result, Greenland itself doesn’t see any local sea level rise.
But all of its melted ice — currently averaging 281 gigatons a year, as measured by the U.S./German Gravity Recovery and Climate Experiment (GRACE) and GRACE Follow-on (GRACE-FO) satellite missions — has to go somewhere. Gravity causes it to flow into the ocean, causing sea level to rise thousands of miles away. Data from GRACE-FO tell us that melting land ice in glaciers, ice caps, and ice sheets contributed about two-thirds of global sea level rise during the last decade.
These images, created from GRACE data, show changes in Greenland ice mass since 2002. Orange and red shades indicate areas that lost ice mass, while light blue shades indicate areas that gained ice mass. White indicates areas where there was very little or no change in ice mass since 2002. In general, higher-elevation areas near the center of Greenland experienced little to no change, while lower-elevation and coastal areas experienced up to 4 meters (13.1 feet) of ice mass loss (expressed in equivalent-water-height; dark red) over a 14-year period. The largest mass decreases of up to 30 centimeters (11.8 inches) (equivalent-water-height) per year occurred along the West Greenland coast. The average flow lines (grey; created from satellite radar interferometry) of Greenland’s ice converge into the locations of prominent outlet glaciers, and coincide with areas of high mass loss. Credit: NASA
As land ice in Greenland, Antarctica and elsewhere melts, it changes Earth’s gravity field and slightly shifts the direction of Earth’s rotation. This causes uneven changes in sea level across the globe. Each melting ice mass around the world creates its own unique pattern of sea level change in the global ocean. For example, when ice melts in Antarctica, the amount of sea level rise it generates in California and Florida is up to 52 percent greater in those locations than if the global ocean just filled up uniformly, like water in a bathtub. Scientists use gravity data from the GRACE-FO mission to calculate patterns of sea level change associated with the loss of ice from glaciers, ice caps and ice sheets, as well as from changes in land water storage.
In this animation, computed from data gathered by the twin GRACE satellites since 2002, sea level is dropping around rapidly melting Greenland (orange, yellow). But near coastlines at a sufficient distance, the added water causes sea levels to rise (blue). The computational method is described in Adhikari et al. (2016, Geoscientific Model Development). These solutions are presented in Adhikari and Ivins (2016, Science Advances). Credit: NASA-JPL/Caltech
Then there’s vertical land motion along coastlines. When land sinks (a process known as subsidence), it causes a relative increase in sea levels. When land rises (known as uplift), it results in a relative decrease in sea levels.
A number of factors, both natural and human-produced, cause land to rise or sink, including:
- Adjustments related to the rebound of land during and following the retreat of past ice sheets in North America and Eurasia at the end of the last Ice Age (known as isostatic, or post-glacial, rebound). The retreat of the ice sheets lightened the load of mass on the underlying mantle deep below Earth’s surface, causing Earth’s surface there to slowly rise. Land areas that were once near the edge of these ancient ice sheets, such as along the U.S. eastern seaboard, are today falling, exacerbating sea level rise there.
A model of present-day vertical land motion due to post-glacial rebound and the reloading of the ocean basins with seawater. Blue and purple areas indicate rising due to the removal of the ice sheets. Yellow and red areas indicate falling as mantle material moved away from these areas in order to supply the rising areas, and because of the collapse of the forebulges around the ice sheets. Credit: NASA-JPL/Caltech -
Plate tectonics. Earth is divided into multiple slowly moving tectonic plates that interact with each other along plate boundaries. At some plate boundaries, the motion of one plate under, over, or past another results in vertical uplift or subsidence of the land surface above.
-
Natural or human-produced compaction of sediments, such as those caused by pumping groundwater, or oil and gas. Subsidence related to groundwater withdrawal can be especially pronounced in areas with large populations and extensive agriculture. Sediments can also be compacted by construction activities by humans or by the natural settling of new soils. In the United States, subsidence is a major factor in relative sea level rise along parts of the Gulf and East Coasts.
Oceanographer and climate scientist Josh Willis of NASA’s Jet Propulsion Laboratory in Southern California says that when it comes to relative sea level rise at any particular coastal location, subsidence is the most immediate consideration.
“People in coastal areas need to know what the land is doing right now where they live,” he said. “Is it sinking? If so, how fast? When you combine a sinking coastline with sea level rise caused by other contributing factors, you’re in trouble. Remember, scientists are projecting feet of global-mean sea level rise in this century. But in some places, land can sink by one foot in a decade. We have to understand all of these pieces before we can project future sea level rise at a beach near you.”
June 23, 2020, 09:33 PDT
Sea Change: Why Long Records of Coastal Climate Matter
A Monitoring Station off the Coast of Spain Is Giving Scientists a Front-Row Seat to Understanding the Region’s Long-Term Climate Change

L'Estartit, a small Spanish coastal town in the Catalan Costa Brava region of the northwestern Mediterranean Sea. A half-century of continuous data from a meteorological and oceanographic coastal station here are giving scientists important insights into the region's long-term climate trends. Credit: Cnestartit / CC BY-SA
Climate scientists will tell you a key challenge in studying climate change is the relative dearth of long-term monitoring sites around the world. The oldest continuously operating station — the Mauna Loa Observatory on Hawaii’s Big Island, which monitors carbon dioxide and other key constituents of our atmosphere that drive climate change — has only been in operation since the late 1950s.
This obstacle is even more profound in the world’s coastal areas. In the global open ocean, the international Argo program’s approximately 4,000 drifting floats have observed currents, temperature, salinity and other ocean conditions since the early 2000s. But near coastlines, the situation is different. While coastal weather stations are plentiful, their focus is to produce weather forecasts for commercial and recreational ocean users, which aren’t necessarily useful for studying climate. The relative lack of long-term records of surface and deep ocean conditions near coastlines has limited our ability to make accurate oceanographic forecasts.
A meteorological and oceanographic coastal station in the small Spanish coastal town of L’Estartit is a notable exception. Located in the Catalan Costa Brava region of the northwest Mediterranean Sea, the L’Estartit station has collected inland data on air temperature, precipitation, atmospheric pressure and humidity since 1969, and has also made oceanographic observations at least weekly since 1973. This makes L’Estartit the longest available uninterrupted oceanographic data time series in the Mediterranean. A new NASA-funded study presents a detailed analysis of the site, revealing climate trends for its Mediterranean coastal environment spanning nearly a half century.
“The long-term data set from L’Estartit is a treasure trove that’s useful for assessing the regional impacts of climate change and how it’s evolved over time."
The study, led by Jordi Salat of the Institut de Ciències del Mar (CSIC) in Barcelona, provides estimates of annual trends in sea and atmospheric temperature and sea level, along with seasonal trends. It also compares data from the site with previous and other estimates of climate trends in the region. Co-authors include Josep Pascual, also with CSIC; oceanographers Jorge Vazquez and Mike Chin of NASA’s Jet Propulsion Laboratory in Southern California; and Mar Flexas of Caltech, also in Southern California.
The Evolution of Modern Ocean Monitoring
The existence of the L’Estartit station reflects the results of decades of scientific research dating back to the 20th century. This body of work has established the vital role the ocean plays, in conjunction with our atmosphere, in shaping Earth’s global weather and climate. While sea level and sea state have been monitored regularly for some time, other measurements of oceanic conditions haven’t been as well-chronicled. In order to reconstruct the climate history of the ocean, scientists have typically relied on data from coastal tide gauges and stationary mooring stations, along with oceanographic cruises that weren’t generally part of any coordinated monitoring program.
By the 1980s, however, as Earth’s global climate warming trend became evident, scientists began to establish international programs to conduct long-term studies of the ocean. As a result, in recent years, scientists have increasingly acknowledged the value of having the oceanographic equivalent of weather forecasts. Maintaining regular, long-term records of air temperature, water temperatures at the surface and at various depths, winds, sea level, salinity, and other key oceanographic parameters gives scientists valuable information on long-term average values, how variable our climate is and on long-term changes and trends. Moreover, they help scientists better evaluate how humans are contributing to climate change.
Over the past 20 to 30 years, new technologies have given scientists the ability to monitor the ocean all the way from the sea surface to the ocean floor. These include satellites, drifters, gliders, moorings, buoys, Argo profilers and ship data. These data are used as inputs to computer models to estimate the state of the ocean, make ocean forecasts and estimate climate trends.
L’Estartit: Monitoring a Climate Hot Spot
Maintained by voluntary observer Josep Pascual in collaboration with CSIC and the authority of the marine protected area, the L’Estartit station is well positioned to monitor the Mediterranean, a region of our planet that’s significantly impacted by climate change. It lies at the southern end of a relatively narrow offshore continental shelf and along the coastal side of the Northern Current, the main along-slope ocean current in the northwestern Mediterranean.
You can think of the Mediterranean as sort of a miniature ocean, since most of the processes that take place in the global ocean also take place here, albeit at different time scales in some instances. Its relatively small size also makes it more accessible to monitoring than many other regions of the global ocean. Because it’s located in Earth’s mid latitudes, it experiences significant seasonal variations, which affect the way it exchanges heat with the atmosphere.
The L’Estartit site collects a broad array of oceanographic data. In addition to the data mentioned previously, the site began continuous measurements of potential daily evaporation in 1976; and has measured sea state, along with wind speed and direction, since 1988. With the installation of a tide gauge in the harbor in 1990, continuous sea level data have been collected. Also added in the 1990s were conductivity-temperature-depth (CTD) profiles and water samples to analyze the temperature and salinity of the water column.
L’Estartit’s long-term data record makes it possible for scientists to calculate trends for a variety of atmospheric and oceanic climate attributes, including air temperature, sea surface and sub-surface temperature to a depth of 80 meters (262 feet), air pressure, relative humidity, relative cloudiness, wind, salinity, changes in ocean stratification, estimates of favorable conditions for evaporation, sea level and precipitation.
“The long-term data set from L’Estartit is a treasure trove that’s useful for assessing the regional impacts of climate change and how it’s evolved over time,” said Vazquez. “The data can be used as reference for other areas in the Mediterranean. The strong agreement between the site’s measurements of sea surface temperatures and satellite data of sea surface temperatures demonstrates how L’Estartit can serve as both a long-term ground truth site to validate satellite observations and as a regional monitoring site for climate change.”
Vazquez says data from the site have been used in numerous climate research studies and have also been used to document a variety of extreme events, from cold spells and heat waves to storms.
A Half-Century of Climate Trends
The researchers’ analysis of the nearly 50-year data set reveals numerous climate trends. For example, air temperature has increased by an average of 0.05 degrees Celsius (0.09 degrees Fahrenheit) per year during this time. Sea surface temperature has increased by an average of 0.03 degrees Celsius (0.05 degrees Fahrenheit) per year, while the temperature of the ocean at a depth of 80 meters (262 feet) has increased by an average of 0.02 degrees Celsius (0.04 degrees Fahrenheit) per year.
While sea level in the Mediterranean decreased from the 1960s to the 1990s due to changes in the North Atlantic Oscillation (a multi-decadal cyclical fluctuation of atmospheric pressure over the North Atlantic Ocean that strongly influences winter weather in Europe, Greenland, northeastern North America, North Africa and northern Asia), it’s been on the rise since the mid-1990s. The L’Estartit data show that sea level at that site is currently rising at a rate of 3.1 millimeters (0.12 inches) per year.
The researchers found that some of the long-term climate trends they observed were more pronounced during some seasons than in others. For example, trends in air temperature and sea surface temperature were significantly stronger during spring, while the trend for ocean temperature at 80 meters was greatest during autumn. Among their other findings, they noted a small increase in the number of days per year that experience summer-like sea conditions. They also found an almost two day per year drop in conditions favorable for marine evaporation, which may be related to an observed decrease in springtime coastal precipitation.
Vazquez says the good statistical comparison between sea surface temperature values and trends from the L’Estartit data set and data from available satellite products is encouraging. “The long-term consistency of the direct measurements with our satellite data gives scientists the opportunity to validate climate trends across multiple decades,” he said. “Data from L’Estartit should serve as a wake-up call to the global climate science community to immediately begin similar initiatives and ensure their continuity over time.”
The L’Estartit data are available to the public free of charge. The digitized data are accessible at http://meteolestartit.cat/. The remote sensing data used in the study may be retrieved through NASA’s Physical Oceanography Distributed Active Archive Center (PO.DAAC) at http://podaac.jpl.nasa.gov.
June 3, 2020, 07:20 PDT
Sea Level 101: What Determines the Level of the Sea?

Photo of the Pacific Ocean. Credit: Michael Matti, Flickr/Creative Commons
Lots of forces are at work on the world’s ocean, and NASA studies them all. When it comes to sea level, NASA does much more than just measure it; they also seek to understand it. But for non-scientists, fathoming the forces that determine sea levels around the world can sometimes be a bit daunting, so here’s a little guide to some of the basics.
Let’s dive in.
Waves in the Bathtub
Most of the time, Earth’s ocean looks pretty darn flat to those of us here on the ground, like the water in a bathtub. If you’re on a boat at sea, the only topography you’re going to notice on the ocean is waves. Generated by the friction between wind and water, wind waves range from tiny ripples on a calm sea to storm-generated monsters that can tower more than 100 feet (30 meters) high. Some wind waves are generated locally. Others, called swells, which result from winds that blew somewhere else in the past, travel across the ocean surface.
But even in the absence of waves, it turns out the ocean isn’t really flat at all. It has hills and valleys just like land surfaces do, though they’re relatively small — up to about 2 meters (6.5 feet) high.
These small variations in ocean surface topography are influenced by many factors, including the temperature of the water, how much salt it contains (its salinity), the pressure of the atmosphere above the ocean surface, and ocean currents.
Currents move ocean waters around our planet over long distances, primarily in a horizontal direction, reshaping the ocean’s surface and causing it to tilt. They’re generated by various forces, including winds, breaking waves, ocean temperature, salinity, and a phenomenon known as the Coriolis effect (which causes water and wind to deflect to the right in the Northern Hemisphere and to the left in the Southern Hemisphere). Currents flow around the ocean’s hills and valleys, much like wind blows around areas of high and low pressure in our atmosphere.
Ocean currents happen in the open ocean and generally don’t have a big impact on coastlines, with a few major exceptions, such as the Gulf Stream in the Atlantic Ocean along the U.S. East Coast and a similar Pacific Ocean current off the coast of Japan called the Kuroshio, which transports water northward up Japan’s east coast and then due east. As our planet warms, it affects wind patterns that drive most of these currents, changing them.
While all of these factors are important drivers of ocean surface topography, there’s an even larger force working to shape the ocean: changes in Earth’s geoid. The geoid is the shape that Earth’s ocean surface would take if the only influences acting upon it were gravity and Earth’s rotation. Changes in the solid Earth affect Earth’s gravitational field, causing the height of Earth’s geoid to vary by up to 100 meters (328 feet) around the globe. For example, in places where Earth’s crust is thick and dense, the gravitational pull causes extra water to pile up. In addition, the shape of the geoid is partly determined by geologic features on the floor of the ocean, including seamounts (underwater mountains) and valleys, which pull the water due to the force of gravity.
Topographic features on the open ocean can only be seen from space, by specialized instruments called altimeters that precisely measure the height of the ocean surface.
Since 1992, NASA has partnered with other U.S. and European institutions on multiple satellite missions to map ocean surface topography. They include the joint NASA/Centre National d'Etudes Spatiales (CNES) Topex/Poseidon mission, which operated from 1992 to 2005; the NASA/CNES Jason-1, which operated from 2001 to 2013; the joint NASA/CNES/National Oceanic and Atmospheric Administration (NOAA)/European Organisation for the Exploitation of Meteorological Satellites (EUMETSAT) Jason-2/Ocean Surface Topography Mission (OSTM), which operated from 2008 to 2019; and the current Jason-3, an international partnership led by NOAA with participation by NASA, CNES and EUMETSAT, launched in 2016. This November, Sentinel-6 Michael Freilich will launch to continue this long-term data set. The new mission is jointly developed by the European Space Agency (ESA), EUMETSAT, NASA and NOAA with funding support from the European Commission and support from CNES.
Measuring ocean surface topography allows us to understand ocean circulation (how our ocean stores energy from the Sun and moves it around our planet), accurately track changes in global sea level, and understand how the ocean joins forces with Earth’s atmosphere to create our weather and climate, including phenomena such as El Niño and La Niña and weather patterns such as hurricanes and other storms.
A Flattening Map
A look at a current map of trends in the nearly 30-year satellite record of global ocean surface topography reveals clear regional differences across the globe, with variations of up to 20 centimeters (8 inches) of sea level rise and fall from one place to another. But, says Josh Willis of NASA’s Jet Propulsion Laboratory in Pasadena, California, NASA’s project scientist for the Jason-2, Jason-3 and Sentinel-6 Michael Freilich missions, the map is getting flatter every year.
“Most of these 20-to-30 centimeter (8-to-12 inch) changes in sea level on the open ocean are cyclic, from natural things like El Niño and La Niña, or ocean currents speeding up or slowing down,” he said. “They've always been part of the story and always will be. But what really matters to people at the coast are long-term changes in their relative sea level – that is, the height of the ocean relative to the land. Those are caused by the overall rise due to global warming, and the movement of the land. And both of those are here to stay.”
Up next: why all sea level is "local."
May 13, 2020, 10:14 PDT
Can't 'See' Sea Level Rise? You're Looking in the Wrong Place
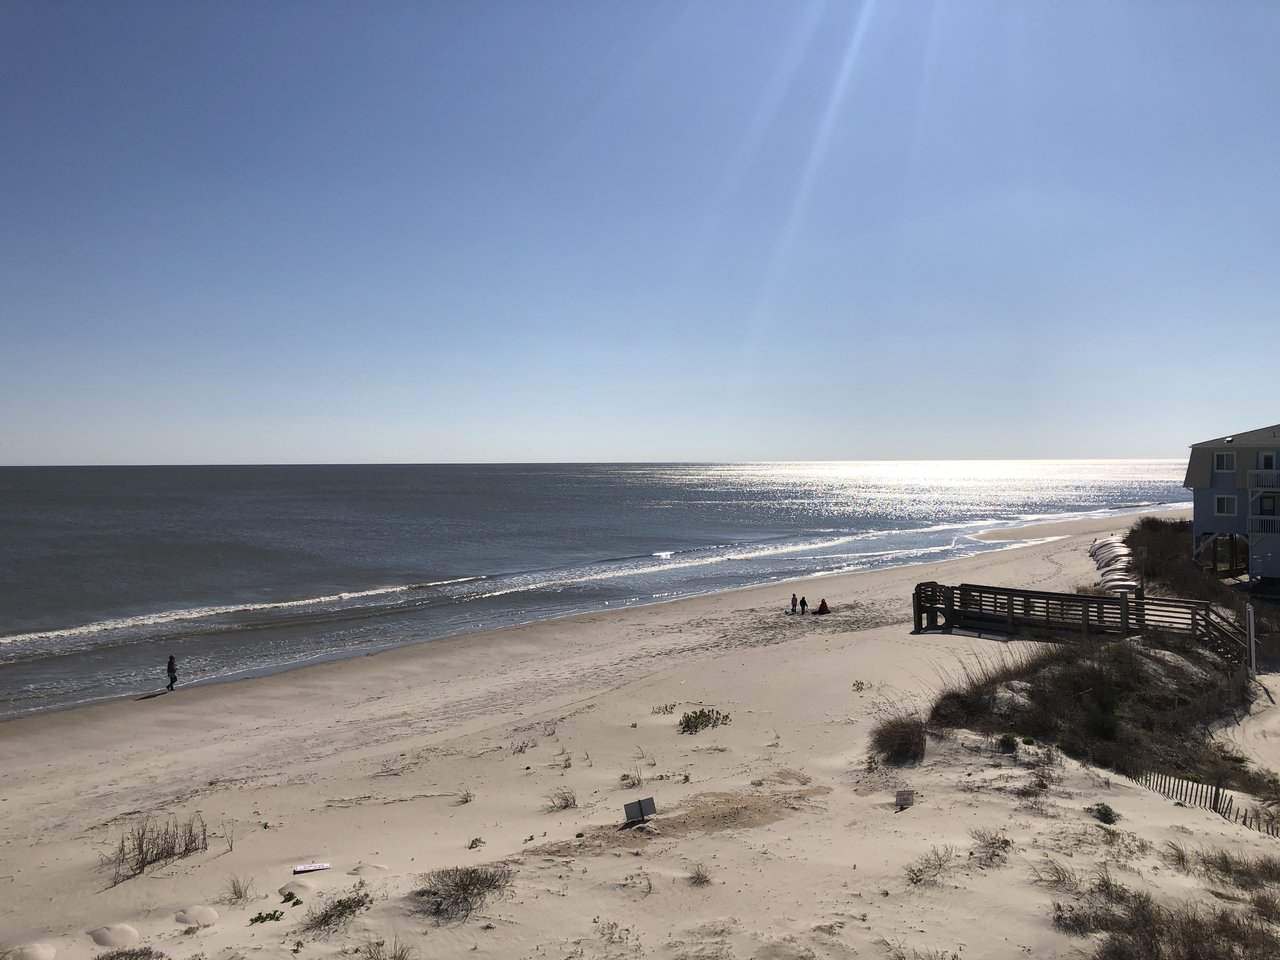
Like most beaches in North Carolina, Ocean Isle Beach experiences coastal erosion. Sea level rise accelerates and exacerbates the natural coastal erosion that's continually taking place here and at beaches around the world. Credit: NASA/JPL-Caltech
Recently I stayed in a lovely vacation rental at the eastern end of Ocean Isle Beach, a small town on North Carolina’s southern coast not far from Myrtle Beach, South Carolina. Located on a 5-mile-long (8-kilometer-long) barrier island, the community is separated from the mainland by the Atlantic Intracoastal Waterway and marsh savannas. It’s a pleasant seaside resort, with restaurants, tourist amenities, and row upon row of stilt homes, many right on the beach. My bedroom looked out over small sand dunes to the shimmering Atlantic, which, at high tide, ebbed and flowed not much farther than a stone’s throw away. From my vantage point, there were no clues that the sea here might not always be a friendly neighbor.
A short stroll along the beach quickly provided a starkly different perspective. Just a few dozen yards away, huge sandbags were piled high, guarding a number of homes from the sea. As I continued walking, I soon found myself in front of homes that were perched literally above the waves at high tide.
I passed a woman walking her dog and asked her about the homes. “There used to be two streets of houses in front of these homes,” she told me. “Now they’re oceanfront.”
It turns out the homes at the east end of Ocean Isle Beach were victims of coastal erosion, which is common at most beaches in North Carolina and throughout the world. An eroding beach can lose several feet of sand a year. Of course, storms, including hurricanes, can result in rapid beach erosion. But there’s also chronic, long-term erosion, caused by changes in the supply of sand to a beach and in relative sea level (how much the height of the ocean rises or falls relative to the land at a particular location). Records show sea level in this part of coastal North Carolina has risen about 7.6 centimeters (3 inches) since the early 1980s. According to the U.S. Global Change Research Program, coastal erosion results in U.S. coastal property losses of about a half billion dollars each year in the form of damaged structures and lost land.
The case of Ocean Isle Beach illustrates a key paradox about sea level rise: since it occurs relatively slowly, it can be easy to think it’s not happening. But as oceanographer and climate scientist Josh Willis of NASA’s Jet Propulsion Laboratory in Pasadena, California, told me, if you’re not seeing it, you’re just not looking in the right place.
“Thanks to satellite and tide gauge data, we know that sea level is rising about 3.3 millimeters (0.13 inches) a year, a rate that grows by another 1 millimeter (0.04 inches) per year every decade or so,” Willis said. “Each year, global warming is currently adding about 750 gigatonnes of water to the ocean – enough to cover my home state of Texas about 1 meter (more than 3 feet) deep. We can’t really eyeball a few millimeters of sea level rise a year just by looking at the ocean because of waves, tides, etc. But we can definitely see the effects of it, both short- and long-term.”
Willis said sea level rise accelerates and exacerbates the natural coastal erosion that’s continually taking place in locations like Ocean Isle Beach. “Sea level rise literally eats away at a coastline, making it more vulnerable to floods,” he said. “While floods happen naturally, it’s sea level rise that causes them to gradually begin topping natural barriers—like wetlands, mangrove forests and saltwater marshes—and even human-built barriers that typically protect coastal areas around the world from flooding. All of a sudden, that flood that you used to be protected from is now wiping you out.”
It’s the same story all over the world. You may not be able to eyeball sea level rise at your local beach, but its effects are being felt in many ways. Willis says a good rule of thumb is that every inch of sea level rise results in the loss of about 2.5 meters (100 inches) of beach, though recent studies suggest beach losses around the globe could happen even faster.
In many places, sea level rise has rendered sea walls erected decades ago to handle 100-year floods inadequate. Floods that used to occur once a century are now happening once a decade. You can also see the impacts of sea level rise reflected in gradual damage to infrastructure, such as the condition of coastal roads like California’s Pacific Coast Highway, which is continually battling the effects of coastal erosion.
Another phenomenon many people are experiencing more frequently but may not necessarily think is an impact of sea level rise is high tide flooding, otherwise known as “nuisance,” or “sunny day” flooding. This type of flooding, which is generally low-level, occurs year-round during high tides. Its effects range from inconveniences to the public, such as the closure of roads, businesses and schools, to long-term infrastructure damage and overwhelmed storm drains. Climate-related sea level rise is a primary contributor to high tide flooding, as is the loss of natural coastal barriers. Another contributor is the sinking of coastal lands due to adjustments related to the end of the last Ice Age, tectonics, compaction of sediments, and other dynamic processes. In the United States, high tide flooding is especially common along the East and Gulf Coasts. Over the last two decades, their frequency is up by roughly 50 percent; 100 percent if you go back three decades.
Norfolk, Virginia, is a good case in point. Norfolk, home to the world’s largest Naval base, is one of several municipalities that comprise Virginia’s Hampton Roads region, which has a population of more than 1.8 million. In the 20th Century, sea level relative to land in Norfolk rose between 4 and 5 millimeters (0.16 to 0.2 inches) a year, in part because the land in this region is sinking as it continues to adjust to the melting of the Laurentide ice sheet that covered it during the last Ice Age. Over the past couple of decades, high tide flooding here has accelerated rapidly, and now occurs about 10 days a year, causing flooding in downtown Norfolk.
“We’ve had such a large amount of sea level rise in the past century that we’re now nearing a tipping point,” said Ben Hamlington, a research scientist in JPL’s Sea Level and Ice Group. “When many coastal communities like Norfolk were established, developers took into account where historical high tide lines were, then added a safety gap to account for floods. But long-term climate change is narrowing that safety gap and a storm event is no longer required to cause significant flooding. The combination of long-term sea level rise and natural variations in sea level caused by climate cycles such as El Niño and the Pacific Decadal Oscillation (PDO) is leading to a dramatic increase in high-tide flooding events. As a result, coastal communities must now take these different natural climate cycles into account in their planning.”
Willis says sea level rise is causing some cities around the world to face the ultimate choice: spend huge sums of money to combat sea level rise, or literally abandon ship and move away. Last year, Indonesia announced plans to move its capital inland from Jakarta, a city of 10 million that’s sinking and challenged by sea level rise. In cities all over the world, local officials are confronting their own battles. Even relatively affluent metropolitan areas like Southern California aren’t immune. But many places, such as Bangladesh, parts of southeast Asia and small island nation states, simply don’t have the resources.
Willis says California and the U.S. West Coast have been spared the worst effects of sea level rise over the past 20 years. But that may be about to change.
“Over the past 15 to 20 years, we’ve been watching warm waters in the Pacific Ocean move away from the West Coast due to a shift in the PDO, a long-term ocean fluctuation pattern that’s similar to the El Niño/La Niña cycles but that operates on a much larger scale, waxing and waning about every 20 to 30 years,” he said. “This has served to counteract the effects of global sea level rise, so that along the U.S. Pacific Coast, we’ve seen almost no sea level rise over that time. But those days are over. Since the major El Niño of 2015-16, the PDO has shifted and the West Coast is likely to see faster-than-average sea level rise in the next 20 years. We’re already beginning to see this. California, in particular, needs to prepare. We could see increases up to 1 centimeter (0.4 inch) a year, more than three times the global rate.”
Such a rate of sea level rise would equate to more than 20 centimeters (8 inches) in the next two decades. To put that into perspective, over the past century, sea level along California’s coast has gone up about 23 centimeters (9 inches). This will pose major challenges for many parts of the Golden State, from San Francisco and San Diego Bays, to the Ports of Long Beach and Los Angeles, and cities in coastal Orange County, to name a few. “We think of California as having a lot of cliffs,” says Willis. “It does, but in between, there are lots of low-lying areas where sea level rise is going to cause problems.”
Whether you want to see it or not, sea level rise is a global problem. And that’s no day at the beach.
May 6, 2020, 10:16 PDT
Fire and Ice: Why Volcanic Activity Is Not Melting the Polar Ice Sheets

Mount Waesche is a 10,801-foot-high (3,292 meters) possibly active volcano at the southern end of the Executive Committee Range in Marie Byrd Land, Antarctica. Credit: NASA/Michael Studinger
Few natural phenomena are as impressive or awesome to behold as glaciers and volcanoes. I’ve seen both with my own eyes. I’ve marveled at the enormous power of flowing ice as I trekked across a glacier on Washington’s Mount Rainier — an active, but dormant, volcano. And I’ve hiked a rugged lava field on Hawaii’s Big Island alone on a moonless night to witness the surreal majesty of a lava stream from Kilauea volcano spilling into the sea — its orange-red lava meeting the waves in billowing steam — while still more glowing ribbons of lava snaked down the mountain slopes behind me.
There are many places on Earth where fire meets ice. Volcanoes located in high-latitude regions are frequently snow- and ice-covered. In recent years, some have speculated that volcanic activity could be playing a role in the present-day loss of ice mass from Earth’s polar ice sheets in Greenland and Antarctica. But does the science support that idea?
In short, the answer is a definitive “no,” though recent studies have shed important new light on the matter. For example, a 2017 NASA-led study by geophysicists Erik Ivins and Helene Seroussi of NASA’s Jet Propulsion Laboratory added evidence to bolster a longstanding hypothesis that a heat source called a mantle plume lies deep below Antarctica's Marie Byrd Land, explaining some of the melting that creates lakes and rivers under the ice sheet. While the study may help explain why the ice sheet collapsed rapidly in an earlier era of rapid climate change and why it’s so unstable today, the researchers emphasized that the heat source isn't a new or increasing threat to the West Antarctic ice sheet, but rather has been going on over geologic timescales, and therefore represents a background contribution to the melting of the ice sheet.
I checked in with Ivins and Seroussi to get a deeper understanding of this question, which our readers frequently ask about. Here's what I learned…
Greenland Has a Long-Departed “Hot Spot” but Is Now Quiet
Since 2002, the U.S./German Gravity Recovery and Climate Experiment (GRACE) and GRACE Follow-On (GRACE-FO) satellite missions have recorded a rapid loss of ice mass from Greenland — at a rate of approximately 281 gigatonnes per year.
There’s plenty of evidence of volcanism in regions now covered by the Greenland ice sheet and the mountains around it, but this volcanic activity occurred in the distant past. Many of Greenland’s mountains are eroded flood basalts — high-volume lava eruptions that cover broad regions. Flood basalts are the biggest type of lava flows known on Earth.
But volcanic activity isn’t responsible for the current staggering loss of Greenland’s ice sheet, says Ivins. There are no active volcanoes in Greenland, nor are there any known mapped, dormant volcanoes under the Greenland ice sheet that were active during the Pliocene period of geological history that began more than 5.3 million years ago (volcanoes are considered active if they’ve erupted within the past 50,000 years). In fact, he says, the history of the Greenland ice sheet is probably more connected to atmospheric and ocean heat than it is to heat from the solid Earth. Ten million years ago, there was actually very little ice present in Greenland. The whole age of ice sheet waxing and waning in the Northern Hemisphere didn’t really get going until about five million years ago.
While there are no active volcanoes in Greenland, scientists are confident a “hot spot” — an area where heat from Earth’s mantle rises up to the surface as a thermal plume of buoyant rock — existed long ago beneath Greenland because they can see the residual heat in Earth’s crust, Ivins says. While mantle plumes can drive some forms of volcanoes, Ivins says they aren’t a factor in the current melting of the ice sheet. Researchers hypothesize however that this residual heat may drive the flow of the Northeast Greenland Ice Stream, which penetrates hundreds of kilometers inland (an ice stream is a faster-flowing current of ice within a larger and more stagnant ice sheet). Recent modeling experiments show that if enough residual heat is present, it can initiate an ice stream. GPS measurements also provide evidence that a hot spot once existed beneath Greenland.
That hot spot subsequently moved, however, and now lies beneath Iceland — home to about 130 volcanoes, of which roughly 30 are active. The hot spot is at least partially responsible for the island’s high volcanic activity. Iceland also lies along the tectonically active Mid-Atlantic Ridge.
Antarctica Has Volcanoes, but There's No Link to its Current Ice Loss
The GRACE missions have also observed a rapid loss of ice mass in Antarctica, at a rate of approximately 146 gigatonnes per year since 2002. Unlike Greenland, however, there’s substantial evidence of volcanoes under the Antarctic Ice Sheet, some of which are currently active or have been in the recent geologic past. While the exact number of volcanoes in Antarctica is unknown, a recent study found 138 volcanoes in West Antarctica alone. Many of the active volcanoes are located in Marie Byrd Land. However, there’s no evidence of a dramatic volcanic eruption in Antarctica in the recent geologic past. Seroussi says details about the volcanism of many parts of Antarctica (particularly in East Antarctica) remain uncertain, both because they’re covered by ice and because their remoteness makes surveying them difficult.
Multiple additional lines of evidence point to Antarctica’s past and present volcanism. For example, topographic maps of the bedrock beneath the Antarctic ice sheet give scientists clues to suspected volcanic locations. Analyses of volcanic rock samples reveal numerous volcanic eruptive events within the last 100,000 years, as do ash layers in ice cores. In their 2017 study of Marie Byrd Land, Seroussi and Ivins estimated the intensity of the heat produced by the hypothesized mantle plume by studying the meltwater produced under the ice sheet and its motion by measuring changes in the elevation of the ice surface.
Antarctica's Bedrock
These images depict the differences between Antarctica's ice sheet with its underlying topography. Click and drag the white bar to compare the images. (Vertical scale has been magnified by a factor of 17 to make terrain features such as mountains and valleys more visible.)
The topography map, called Bedmap2, was compiled by the British Antarctic Survey and incorporates millions of new measurements, including substantial data sets from NASA's ICESat satellite and an airborne mission called Operation IceBridge. Credit: NASA's Goddard Space Flight Center
The topography map, called Bedmap2, was compiled by the British Antarctic Survey and incorporates millions of new measurements, including substantial data sets from NASA's ICESat satellite and an airborne mission called Operation IceBridge. Credit: NASA's Goddard Space Flight Center
An intriguing paper by Loose et al. published in Nature Communications in 2018 provides additional evidence. The researchers measured the composition of isotopes of helium detected in glacial meltwater flowing from the Pine Island Glacier Ice Shelf. They found evidence of a source of volcanic heat upstream of the ice shelf. Located on the West Antarctic ice sheet, Pine Island Glacier is the fastest melting glacier in Antarctica, responsible for nearly a quarter of all Antarctic ice loss. By measuring the ratio between helium’s two naturally-occurring isotopes, scientists can tell whether the helium taps into Earth’s hot mantle or is a product of crust that is relatively passive tectonically.
The team found the helium originated in Earth’s mantle, pointing to a volcanic heat source that may be triggering melting beneath the glacier and feeding the water network beneath it. However, the researchers concluded that the volcanic heat is not a significant contributor to the glacial melt observed in the ocean in front of Pine Island Glacier Ice Shelf. Rather, they attributed the bulk of the melting to the warm temperature of the deep-water mass Pine Island Glacier flows into, which is melting the glacier from underneath.
Seroussi notes the changes happening now, especially in West Antarctica, are along the coast, which suggests the changes taking place in the ice sheet have nothing to do with volcanism, but are instead originating in the ocean. Ice streams reaching inland begin to flow and accelerate as ice along the coast disappears.
In addition, Seroussi says the tectonic plate that Antarctica rests upon is one of the most immobile on Earth. It’s surrounded by activity, but that activity also tends to keep it locked in position. There’s no reason to believe it would change today to impact the melting of the Antarctic ice sheet.
So, in conclusion, while Antarctica’s known volcanism does cause melting, Ivins and Seroussi agree there’s no connection between the loss of ice mass observed in Antarctica in recent decades and volcanic activity. The Antarctic ice sheet is at least 30 million years old, and volcanism there has been going on for millions of years. It's having no new effect on the current melting of the ice sheet.
March 10, 2020, 13:38 PDT
How Climate Change May Be Impacting Storms Over Earth's Tropical Oceans
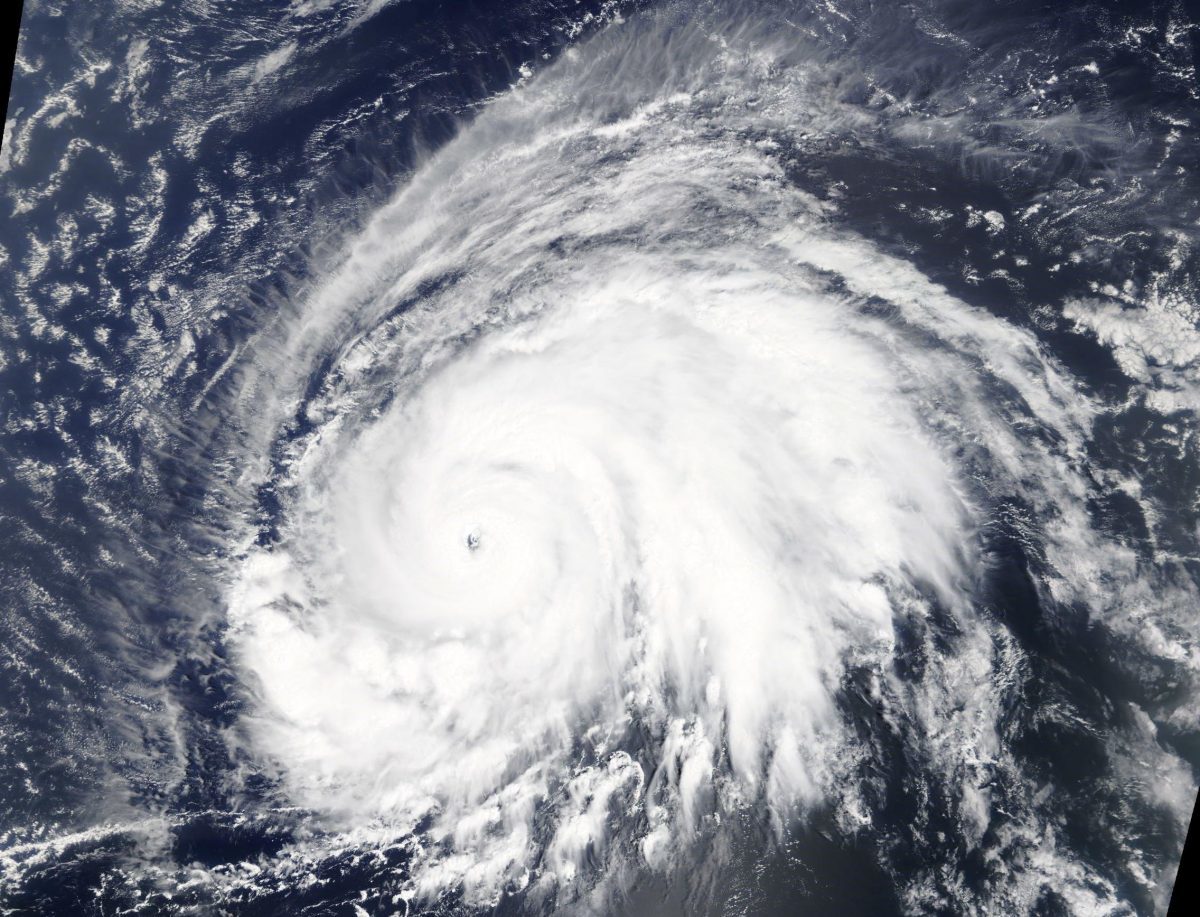
Hurricane Lorenzo moving through the eastern North Atlantic Ocean, as seen from NASA's Terra satellite. Credit: NASA Worldview, Earth Observing System Data and Information System (EOSDIS).
When NASA climate scientists speak in public, they’re often asked about possible connections between climate change and extreme weather events such as hurricanes, heavy downpours, floods, blizzards, heat waves and droughts. After all, it seems extreme weather is in the news almost every day of late, and people are taking notice. How might particular extreme weather and natural climate phenomena, such as El Niño and La Niña, be affected by climate change, they wonder?
There’s no easy answer, says Joao Teixeira, co-director of the Center for Climate Sciences at NASA’s Jet Propulsion Laboratory in Pasadena, California, and science team leader for the Atmospheric Infrared Sounder (AIRS) instrument on NASA’s Aqua satellite. “Within the scientific community it’s a relatively well-accepted fact that as global temperatures increase, extreme precipitation will very likely increase as well,” he says. “Beyond that, we’re still learning.”
“Within the scientific community it’s a relatively well-accepted fact that as global temperatures increase, extreme precipitation will very likely increase as well. Beyond that, we’re still learning.”
While there’s not yet a full consensus on the matter, in recent years a body of evidence linking extreme weather with climate change has begun to emerge. Evidence from satellites, aircraft, ground measurements and climate model projections are increasingly drawing connections. Quantifying those interconnections is a big challenge.
“All our available tools have pros and cons,” says Teixeira. “Rain gauges, for example, provide good measurements, but they’re local and spread far apart. In contrast, satellites typically measure climate variables (such as precipitation, temperature and humidity) indirectly and don’t yet have long enough data records to establish trends, though that’s beginning to change. In addition, representing small-scale processes of the atmosphere that are key to extreme weather events in climate models, such as turbulence, convection and cloud physics, is notoriously difficult. So, we’re in a bit of a conundrum. But great progress is being made as more studies are conducted.”
A simple analogy describes how difficult it is to attribute extreme weather to climate change. Adding fossil fuel emissions to Earth’s atmosphere increases its temperature, which adds more energy to the atmosphere, supercharging it like an athlete on steroids. And just as it’s difficult to quantify how much of that athlete’s performance improvement is due to steroid use, so too it’s difficult to say whether extreme weather events are definitively due to a warmer atmosphere.
Are Supercharged Atlantic Hurricane Seasons a Case in Point?
Take hurricanes, for example. A hot topic in extreme weather research is how climate change is impacting the strength of tropical cyclones. A look at the 2019 Atlantic hurricane season provides a case in point.
After a quiet start to the 2019 season, Hurricane Dorian roared through the Atlantic in late August and early September, surprising many forecasters with its unexpected and rapid intensification. In just five days, Dorian grew from a minimal Category 1 hurricane to a Category 5 behemoth, reaching a peak intensity of 185 miles (295 kilometers) per hour when it made landfall in The Bahamas. In the process, Dorian tied an 84-year-old record for strongest landfalling Atlantic hurricane and became the fifth most intense recorded Atlantic hurricane to make landfall, as measured by its barometric pressure.
Two weeks later the remnants of Tropical Storm Imelda swamped parts of Texas under more than 40 inches (102 centimeters) of rain, enough to make it the fifth wettest recorded tropical cyclone to strike the lower 48 states. Fueled by copious moisture from a warm Gulf of Mexico, the slow-moving Imelda’s torrential rains and flooding wreaked havoc over a wide region.
Then in late September, Hurricane Lorenzo became the most northerly and easterly Category 5 storm on record in the Atlantic, even affecting the British Isles as an extratropical cyclone.
Earth’s atmosphere and oceans have warmed significantly in recent decades. A warming ocean creates a perfect cauldron for brewing tempests. Hurricanes are fueled by heat in the top layers of the ocean and require sea surface temperatures (SSTs) greater than 79 degrees Fahrenheit (26 degrees Celsius) to form and thrive.
Since 1995 there have been 17 above-normal Atlantic hurricane seasons, as measured by NOAA’s Accumulated Cyclone Energy (ACE) Index. ACE calculates the intensity of a hurricane season by combining the number, wind speed and duration of each tropical cyclone. That’s the largest stretch of above-normal seasons on record.
So while there aren’t necessarily more Atlantic hurricanes than before, those that form appear to be getting stronger, with more Category 4 and 5 events.
NASA Research Points to an Increase in Extreme Storms Over Earth’s Tropical Oceans
What does NASA research have to say about extreme storms? One NASA study from late 2018 supports the notion that global warming is causing the number of extreme storms to increase, at least over Earth’s tropical oceans (between 30 degrees North and South of the equator).
A team led by JPL’s Hartmut Aumann, AIRS project scientist from 1993 to 2012, analyzed 15 years of AIRS data, looking for correlations between average SSTs and the formation of extreme storms. They defined extreme storms as those producing at least 0.12 inches (3 millimeters) of rain per hour over a certain-sized area. They found that extreme storms formed when SSTs were hotter than 82 degrees Fahrenheit (28 degrees Celsius). The team also saw that for every 1.8 degrees Fahrenheit (1 degree Celsius) that SST increased, the number of extreme storms went up by about 21 percent. Based on current climate model projections, the researchers concluded that extreme storms may increase 60 percent by the year 2100.
Thanks to weather satellites, scientists have identified possible correlations between the extremely cold clouds seen in thermal infrared satellite images (called deep convective clouds) and extreme storms observed on the ground under certain conditions, especially over the tropical oceans. When precipitation from these clouds hits the top of Earth’s lowest atmospheric layer, the troposphere, it produces torrential rain and hail.
AIRS can’t measure precipitation directly from space, but it can measure the temperature of clouds with extraordinary accuracy and stability. Its data can also be correlated with other climate variables such as SSTs, for which scientists maintain long data records.
To determine the number of extreme storms, Aumann’s team plotted the number of deep convective clouds each day against measurements of sea surface temperature. They found that the number of these clouds correlated with increases in sea surface temperature.
The results of this study reflect a long line of AIRS research and three previously published papers. The researchers say large uncertainties and speculations remain regarding how extreme storms may change under future climate scenarios, including the possibility that a warming climate may result in fewer but more intense storms. But the results of this study point to an intriguing direction for further research.
What Lies Ahead?
Aumann is confident future studies will reveal additional insights into how severe storms detected as individual deep convective clouds coalesce to form tropical storms and hurricanes. He notes that if you look at these clouds over the global ocean, they frequently occur in clusters.
“AIRS sees hurricanes as hundreds of these clusters,” he said. “For example, it saw Hurricane Dorian as a cluster of about 150 deep convective clouds, while Hurricane Katrina contained about 500. If you look at a weather satellite image, you’ll see the severe storms that make up a hurricane are not actually contiguous. In fact, they’re uncannily similar to the stars within the spiral arms of a galaxy. It’s one severe thunderstorm after another, each dumping a quantity of rain on the ground.
“AIRS has 2,400 different frequency channels, so it’s a very rich data set,” he said. “In fact, there’s so much data, our computer capabilities aren’t able to explore most of it. We just need to ask the right questions.”
February 27, 2020, 00:00 PST
Why Milankovitch (Orbital) Cycles Can't Explain Earth's Current Warming

Artist's concept of Earth and Sun. Credit: NASA
In the last few months, a number of questions have come in asking if NASA has attributed Earth’s recent warming to changes in how Earth moves through space around the Sun: a series of orbital motions known as Milankovitch cycles.
What cycles, you ask?
Milankovitch cycles include the shape of Earth’s orbit (its eccentricity), the angle that Earth’s axis is tilted with respect to Earth’s orbital plane (its obliquity), and the direction that Earth’s spin axis is pointed (its precession). These cycles affect the amount of sunlight and therefore, energy, that Earth absorbs from the Sun. They provide a strong framework for understanding long-term changes in Earth’s climate, including the beginning and end of Ice Ages throughout Earth’s history. (You can learn more about Milankovitch cycles and the roles they play in Earth’s climate here).
But Milankovitch cycles can’t explain all climate change that’s occurred over the past 2.5 million years or so. And more importantly, they cannot account for the current period of rapid warming Earth has experienced since the pre-Industrial period (the period between 1850 and 1900), and particularly since the mid-20th Century. Scientists are confident Earth’s recent warming is primarily due to human activities — specifically, the direct input of carbon dioxide into Earth’s atmosphere from burning fossil fuels.
So how do we know Milankovitch cycles aren’t to blame?
First, Milankovitch cycles operate on long time scales, ranging from tens of thousands to hundreds of thousands of years. In contrast, Earth’s current warming has taken place over time scales of decades to centuries. Over the last 150 years, Milankovitch cycles have not changed the amount of solar energy absorbed by Earth very much. In fact, NASA satellite observations show that over the last 40 years, solar radiation has actually decreased somewhat.
Second, Milankovitch cycles are just one factor that may contribute to climate change, both past and present. Even for Ice Age cycles, changes in the extent of ice sheets and atmospheric carbon dioxide have played important roles in driving the degree of temperature fluctuations over the last several million years.
The extent of ice sheets, for example, affects how much of the Sun’s incoming energy is reflected back to space, and in turn, Earth’s temperature.
Then there’s carbon dioxide. During past glacial cycles, the concentration of carbon dioxide in our atmosphere fluctuated from about 180 parts per million (ppm) to 280 ppm as part of Milankovitch cycle-driven changes to Earth’s climate. These fluctuations provided an important feedback to the total change in Earth’s climate that took place during those cycles.
Today, however, it’s the direct input of carbon dioxide into the atmosphere from burning fossil fuels that’s responsible for changing Earth’s atmospheric composition over the last century, rather than climate feedbacks from the ocean or land caused by Milankovitch cycles.
Since the beginning of the Industrial Age, the concentration of carbon dioxide in Earth’s atmosphere has increased 47 percent, from about 280 ppm to 412 ppm. In just the past 20 years alone, carbon dioxide is up 11 percent.
Scientists know with a high degree of certainty this carbon dioxide is primarily due to human activities because carbon produced by burning fossil fuels leaves a distinct “fingerprint” that instruments can measure. Over this same time period, Earth’s global average temperature has increased by about 1 degree Celsius (1.8 degrees Fahrenheit), and is currently increasing at a rate of 0.2 degrees Celsius (0.36 degrees Fahrenheit) every decade. At that rate, Earth is expected to warm another half a degree Celsius (almost a degree Fahrenheit) as soon as 2030 and very likely by 2040.
This relatively rapid warming of our climate due to human activities is happening in addition to the very slow changes to climate caused by Milankovitch cycles. Climate models indicate any forcing of Earth’s climate due to Milankovitch cycles is overwhelmed when human activities cause the concentration of carbon dioxide in Earth’s atmosphere to exceed about 350 ppm.
Scientists know of no natural changes to the equilibrium between the amount of solar radiation absorbed by Earth and the amount of energy radiated back to space that can account for such a rapid period of global warming. The amount of incoming solar radiation has increased only slightly over the past century and is therefore not a driver of Earth’s current climate warming.
Since 1750, the warming driven by greenhouse gases coming from the human burning of fossil fuels is over 50 times greater than the slight extra warming coming from the Sun itself over that same time interval. If Earth’s current warming was due to the Sun, scientists say we should expect temperatures in both the lower atmosphere (troposphere) and the next layer of the atmosphere, the stratosphere, to warm. Instead, observations from balloons and satellites show Earth’s surface and lower atmosphere have warmed but the stratosphere has cooled.
Finally, Earth is currently in an interglacial period (a period of milder climate between Ice Ages). If there were no human influences on climate, scientists say Earth’s current orbital positions within the Milankovitch cycles predict our planet should be cooling, not warming, continuing a long-term cooling trend that began 6,000 years ago.
There’s nothing cool about that.
February 13, 2020, 14:02 PST
There Is No Impending 'Mini Ice Age'

Image of the Sun showing a solar prominence (a large, bright feature extending outward from the Sun's surface). Credit: ESA/NASA
"Pink elephant in the room" time: There is no impending “ice age” or "mini ice age" if there's a reduction in the Sun’s energy output in the next several decades.
Through its lifetime, the Sun naturally goes through changes in energy output. Some of these occur over a regular 11-year period of peak (many sunspots) and low activity (fewer sunspots), which are quite predictable.
The amount of solar energy that Earth receives has followed the Sun’s natural 11-year cycle of small ups and downs with no net increase since the 1950s. Over the same period, global temperature has risen markedly. It is therefore extremely unlikely that the Sun has caused the observed global temperature warming trend over the past half-century. Credit: NASA/JPL-Caltech
But every so often, the Sun becomes quieter for longer periods of time, experiencing much fewer sunspots and giving off less energy. This is called a "Grand Solar Minimum," and the last time this happened, it coincided with a period called the "Little Ice Age" (a period of extremely low solar activity from approximately AD 1650 to 1715 in the Northern Hemisphere, when a combination of cooling from volcanic aerosols and low solar activity produced lower surface temperatures).
Anomalous periods like a Grand Solar Minimum show that magnetic activity and energy output from the Sun can vary over decades, although the space-based observations of the last 35 years have seen little change from one cycle to the next in terms of total irradiance. Solar Cycle 24, which began in December 2008 and is likely to end in 2020, was smaller in magnitude than the previous two cycles.
On occasion, researchers have predicted that coming solar cycles may also exhibit extended periods of minimal activity. The models for such predictions, however, are still not as robust as models for our weather and are not considered conclusive.
But if such a Grand Solar Minimum occurred, how big of an effect might it have? In terms of climate forcing – a factor that could push the climate in a particular direction – solar scientists estimate it would be about -0.1 W/m2, the same impact of about three years of current carbon dioxide (CO2) concentration growth.
Thus, a new Grand Solar Minimum would only serve to offset a few years of warming caused by human activities.
What does this mean? The warming caused by the greenhouse gas emissions from the human burning of fossil fuels is six times greater than the possible decades-long cooling from a prolonged Grand Solar Minimum.
Even if a Grand Solar Minimum were to last a century, global temperatures would continue to warm. The reason for this is because more factors than just variations in the Sun’s output change global temperatures on Earth, the most dominant of those today is the warming coming from human-induced greenhouse gas emissions.
Related post: What Is the Sun's Role in Climate Change?
The Sun powers life on Earth; it helps keep the planet warm enough for us to survive. It also influences Earth’s climate: We know subtle changes in Earth’s orbit around the Sun are responsible for the comings and goings of the past ice ages. But the warming we’ve seen over the last few decades is too rapid to be linked to changes in Earth’s orbit, and too large to be caused by solar activity.
The Sun doesn’t always shine at the same level of brightness; it brightens and dims slightly, taking approximately 11 years to complete one solar cycle. During each cycle, the Sun undergoes various changes in its activity and appearance. Levels of solar radiation go up or down, as does the amount of material the Sun ejects into space and the size and number of sunspots and solar flares. These changes have a variety of effects in space, in Earth’s atmosphere and on Earth’s surface.
The current solar cycle, Solar Cycle 24, began in December 2008 and is less active than the previous two. It’s expected to end sometime in 2020. Scientists don’t yet know with confidence how strong the next solar cycle may be.
What Effect Do Solar Cycles Have on Earth’s Climate?
According to the United Nations’ Intergovernmental Panel on Climate Change (IPCC), the current scientific consensus is that long and short-term variations in solar activity play only a very small role in Earth’s climate. Warming from increased levels of human-produced greenhouse gases is actually many times stronger than any effects due to recent variations in solar activity.
For more than 40 years, satellites have observed the Sun's energy output, which has gone up or down by less than 0.1 percent during that period. Since 1750, the warming driven by greenhouse gases coming from the human burning of fossil fuels is over 50 times greater than the slight extra warming coming from the Sun itself over that same time interval.
Are We Headed for a ‘Grand Solar Minimum’? (And Will It Slow Down Global Warming?)
As mentioned, the Sun is currently experiencing a lower level of sunspot activity. Some scientists speculate that this may be the beginning of a Grand Solar Minimum — a decades-to-centuries-long period of low solar activity — while others say there is insufficient evidence to support that position. During a grand minimum, solar magnetism diminishes, sunspots appear infrequently and less ultraviolet radiation reaches Earth.
The largest recent event -- the “Maunder Minimum,” which lasted from 1645 and 1715 — overlapped with the “Little Ice Age” (13th to mid-19th century). While scientists continue to research whether an extended solar minimum could have contributed to cooling the climate, there is little evidence that the Maunder Minimum sparked the Little Ice Age, or at least not entirely by itself (notably, the Little Ice Age began before the Maunder Minimum). Current theories on what caused the Little Ice Age consider that a variety of events could have contributed, with natural fluctuations in ocean circulation, changes in land use by humans and cooling from a less active sun also playing roles; overall, cooling caused by volcanic aerosols likely played the title role.
Several studies in recent years have looked at the effects that another Grand Solar Minimum might have on global surface temperatures. These studies have suggested that while a grand minimum might cool the planet as much as 0.3 degrees C, this would, at best, slow down but not reverse human-caused global warming. There would be a small decline of energy reaching Earth; however, just three years of current carbon dioxide concentration growth would make up for it. In addition, the Grand Solar Minimum would be modest and temporary, with global temperatures quickly rebounding once the event concluded.
Moreover, even a prolonged Grand Solar Minimum or Maunder Minimum would only briefly and minimally offset human-caused warming.
More about solar cycles:
December 31, 2019, 17:28 PST
2020 Vision: Looking Back to Drive Forward
Earth Science from the Past Decade, and how it Inspires our Future Work
As 2019 comes to an end and a new decade approaches, we look back at all the important Earth science NASA has revealed. This is a time to take stock in all that we have learned and to use those insights to better understand and reliably predict the many ways our planet is changing in the coming decades.
Our planet is an interconnected system, and every new discovery leads to new understandings and new avenues of exploration. Our climate is changing, and NASA spacecraft and science over the past decade have studied it from numerous angles and perspectives. Below are highlights of the science NASA spacecraft have enabled over the past decade, and important topics to study over the decades to come.
2012:Arctic Sea Ice Hits Smallest Extent in Satellite Era

In 2012, the Arctic sea ice cover reached the smallest point observed from space yet, and in the years since, scientists have watched it shrink further. Studying the sea ice loss has brought new insights to the feedback loops that climate change has set in motion. The sea ice cover in the Arctic has, in the past, protected that area of the world from warming. Because ice is a much brighter surface than the dark ocean, it reflected more light and heat. With the loss of that ice, the ocean now absorbs that heat and speeds up warming in the Arctic.
This sea ice loss has also been found to affect the average age of the sea ice, with less and less of the seasonal cover lasting multiple years. Now that much of the multiyear ice has been lost, further changes in ice thickness and age will happen more slowly, as the majority of the sea ice now is seasonal, melting with the summer. Continuing to monitor the Arctic sea ice in the coming years, from airborne and spaceborne platforms, will be critical to understanding the effects of climate change in that region.
2013: For the First Time, Earth’s Single-Day CO2 Tops 400 ppm


In May of 2013, the average global CO2 concentration broke the 400 parts per million (ppm) level, and has since continued to rise. In 2017, the annual minimum CO2 concentration also reached the 400 ppm level, further cementing the importance of tracking the carbon dioxide levels in our atmosphere. Satellite missions like the Orbiting Carbon Observatory 2 (OCO-2) have added space-based global measurements of atmospheric CO2 with the precision, resolution, and coverage needed to characterize sources and sinks (fluxes) on regional scales. The Orbiting Carbon Observatory 3 (OCO-3) was launched in 2019 to expand the horizons of OCO-2 , focusing its instrument on large cities.
When OCO-2 and OCO-3 aren’t studying carbon dioxide, they’re still hard at work measuring plant growth! The OCO-2 science team found that their instrument could also be used to track the tiny amount of glow plants give off when they photosynthesize, and have been studying the health and stress of plants in tandem with the project’s other science objectives
For a student-friendly explanation of the greenhouse effect and how that contributes to rising carbon levels in the atmosphere, visit Climate Kids!
2019: Ozone Hole Is the Smallest on Record Since Its Discovery

NASA has been continuously studying the ozone hole since it was first discovered, and 2019 has shown the smallest hole yet. Typically, it grows to a size of 8 million square miles, but this past year its maximum was 6.3 million miles. While this is good news for the ozone hole, it is not caused entirely by the repair that began with the signing of the Montreal Protocol on Substances that Deplete the Ozone Layer. With no other systems at play, a decrease in chlorofluorocarbons (CFCs) in the atmosphere after they were banned in 1987 would result in the ozone hole reaching its past levels around 2070.
The Antarctic ozone hole forms during the Southern Hemisphere’s late winter as the returning Sun’s rays start ozone-depleting reactions. These reactions involve chemically active forms of chlorine and bromine derived from man-made compounds. The chemistry that leads to their formation involves chemical reactions that occur on the surfaces of cloud particles that form in cold stratospheric layers, leading ultimately to runaway reactions that destroy ozone molecules. In warmer temperatures, fewer polar stratospheric clouds form and they don’t persist as long, limiting the ozone-depletion process.
The smaller hole is in part because of the decrease in CFCs in the atmosphere, but also because of warming temperatures. In warmer temperatures, fewer polar stratospheric clouds form, and they don’t persist as long, limiting the ozone-depletion process.
NASA and the National Oceanic and Atmospheric Administration (NOAA) study the ozone hole in complementary methods. A trio of NASA satellites measure ozone from space, and Aura’s Microwave Limb Sounder instrument estimates levels of chlorine in the atmosphere. NOAA staff, meanwhile, launch weather balloons from the ground that carry ozone-measuring instruments, providing another set of data to pair with the space-based record.
Both agencies will continue to study the ozone hole and how it is affected by climate change in the coming years.
2019: Satellite Data Record Shows Climate Change’s Impact on Fires

From a 2015 study showing that fire seasons are growing longer, to the satellite record displaying the similar effects from space, it is becoming clear that the longer and fiercer fire seasons are also an effect of climate change. The satellite record of the past 20 years has shown a large-scale trend of increased fire activity in places experiencing warming temperatures and a drying climate. A drier climate leads to an increase in burning fuel as plants die out and dry up. Further, warmer temperatures at night result in fires lasting multiple days, where cooler temperatures may have suppressed the fire and kept it from spreading as drastically.
NASA is continuing to study fires from space, and has also launched airborne and ground-based Earth Expeditions, such as FIREX-AQ to further study the effects of more frequent fires on our planet and on human health.
Looking for a student-friendly explanation of wildfires? Check out this video: https://scijinks.gov/wildfires/
2019: GRACE Shows the Weight of Midwestern Floods

In May 2019, after the wettest 12 months ever recorded in the Mississippi River Basin, the region was bearing the weight of 8 to 12 inches (200 to 300 millimeters) more water than average. New data from NASA's Gravity Recovery and Climate Experiment Follow-On (GRACE-FO) mission, which launched in May 2018, showed that there was an increase in water storage in the river basin, extending east around the Great Lakes.
GRACE-FO is a follow-on mission from GRACE, which built a 15-year data record of tracking water mass movement, studying floods, droughts, and ice melt. Some of GRACE’s findings include measuring the melting of both the Greenland and Antarctic ice sheets. The Greenland mass loss trend from April 2002-March 2009 (7 years) is -219 Gigatonnes/year (Gt/yr). The Greenland mass loss trend for the next 7 years, from 2009 to 2016, is -319 Gt/yr. Antarctica’s melt is smaller in magnitude, but there is a more distinct acceleration happening there. For the same seven years, between 2002 and 2009, Antarctica’s trend is -73 Gt/yr. Then, between 2009 and 2016, the trend is -165 Gt/yr. If you’d like to explore and see GRACE’s work yourself, you can access and download the data here.
The twin GRACE-FO spacecraft are used to measure the change in the mass of water across the planet, providing scientists, decision makers and resource managers with an accurate measure of how much water is retained - not only on Earth's surface, but also in the soil layer and below ground in aquifers. Monitoring these changes provides a unique perspective of Earth's climate and has far-reaching benefits for humankind, such as understanding both the possibility and the consequences of floods and droughts.
The continuing work from GRACE-FO will be important in the coming decade as climates around the world change, helping scientists monitor the movement of water around the globe.
2020 and Beyond: Upcoming Missions

NASA’s Earth Science program is ever-evolving, and there are many missions being currently built. Of the many in development, two to keep an eye on are the Surface Water and Topography (SWOT) and NASA-ISRO Synthetic Aperture Radar (NISAR) Missions, both of which will be launching in the next few years. Each new mission being developed will provide a new angle on Earth science, and will help provide a better understanding of the complicated and interconnected systems that govern our planet.
Want to see how your home planet is changing? Explore NASA’s “Images of Change” gallery to see different locations on Earth, showing change over time periods ranging from days to decades.